


Join our Telegram channel to stay up to date with the latest news
Sui price edged down a fraction of a percentage over the past 24 hours to trade at $2.46 as of 4:00 a.m. EST on trading volume that plunged 21% to $843 million.
This is even as 21Shares updated its exchange-traded fund (ETF) Sui application with the US Securities and Exchange Commission (SEC).
The company filed a second amended S-1 for its Sui spot ETF application after the market closed on October 23. The issuer has updated its Sui ETF with crucial information, but there is no mention of the ticker and fees.
$SUI ETF Update: @21shares $SUI Spot ETF S-1 Amendment No. 2 filed with #SECOND after market close today.@SuiNetwork @21shares pic.twitter.com/fxNKfG3ztz
– MartyParty (@martypartymusic) October 23, 2025
Meanwhile, the filing shows that 21Shares US LLC has entered into a staking services agreement with Coinbase Crypto Services.
21Shares updated the filing to list Nasdaq as the stock listing and trading exchange. The issuer added that Bank of New York Mellon will be the ETF’s liquidity custodian.
With the ETF poised to open up a wider market for Sui products, could the price of the token increase significantly?
SUI Price Poised to Bounce Above Key Resistance Levels
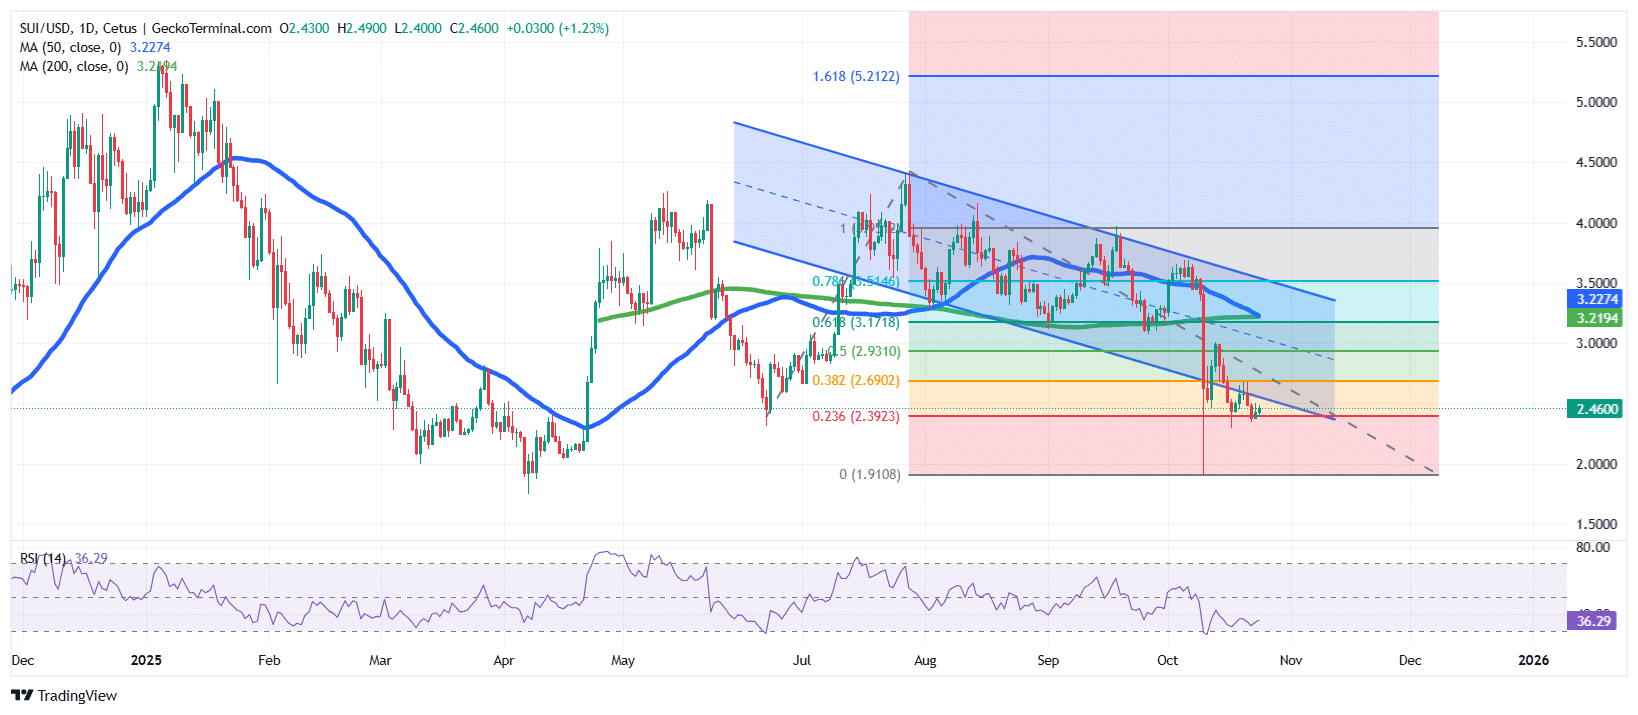
THE SUI Price has been in a prolonged downtrend since mid-July, consistently trading in a descending channel pattern that has kept the token under intense bearish pressure.
After reaching a high near $5.21 earlier in the year, Sui price gradually retraced, testing several Fibonacci retracement levels before settling near $2.40, where it is currently hovering.
The downward move recently found support at the 0.236 Fibonacci level at $2.39, a key technical area that helped stabilize SUI price after an extended period of selling.
Meanwhile, the 50-day simple moving average (SMA) sits at $3.22, closely matching the 200-day SMA ($3.22). This overlap forms a critical confluence resistance zone that SUI must reclaim as support to confirm the shift from bearish to bullish momentum.
Additionally, the Relative Strength Index (RSI) is hovering around 36.29, indicating that it is close to the oversold territory. This reading suggests that the downside momentum may be slowing and buyers may soon step in to cause a near-term rebound.
A surge in the RSI above the 40-45 zone would further confirm strengthening buying interest and a possible trend reversal attempt.
SUI Price Prediction: Bulls Eye Resuming Toward $3.17 Resistance
According to the current SUI/USD chart structure, the Sui price is attempting to rebound from the lower boundary of its bearish channel.
Immediate resistance lies at $2.69, aligned with the 0.382 Fibonacci retracement, followed by $2.93 and $3.17, representing the 0.5 and 0.618 Fibonacci retracement levels, respectively. These levels, particularly the $3.17 region, coincide with the 50-day and 200-day SMAs, forming a major resistance group that will likely determine the next directional move.
If the bulls push Sui price above $3.20, it could trigger a sustained recovery towards $3.54 (.786 Fib) and potentially higher towards the mid-channel region.
However, failure to hold support at $2.39 could expose SUI to further downside risk, with the next key support target near $2.00 to $1.91, aligning with the lower boundary of the Fibonacci retracement zone.
Related news:
Best Wallet – Diversify your crypto portfolio

- Easy-to-use, feature-driven crypto wallet
- Get Early Access to Upcoming Token ICOs
- Multi-chain, multi-wallet, non-custodial
- Now on App Store, Google Play
- Stake to win a $BEST native token
- More than 250,000 active users per month
Join our Telegram channel to stay up to date with the latest news