- Fantom price tested key levels, with increased network activity signaling a potential recovery.
- Market sentiment showed optimism as bullish selloffs and technical indicators hinted at a reversal.
Ghost (FTM), trading at $0.7934 at press time with a 2.16% decline in the last 24 hours, has continued to attract interest despite its current downtrend.
Recent network data showed increased activity, raising the question: could this mark the start of a price reversal?
Can FTM break free from its current range?
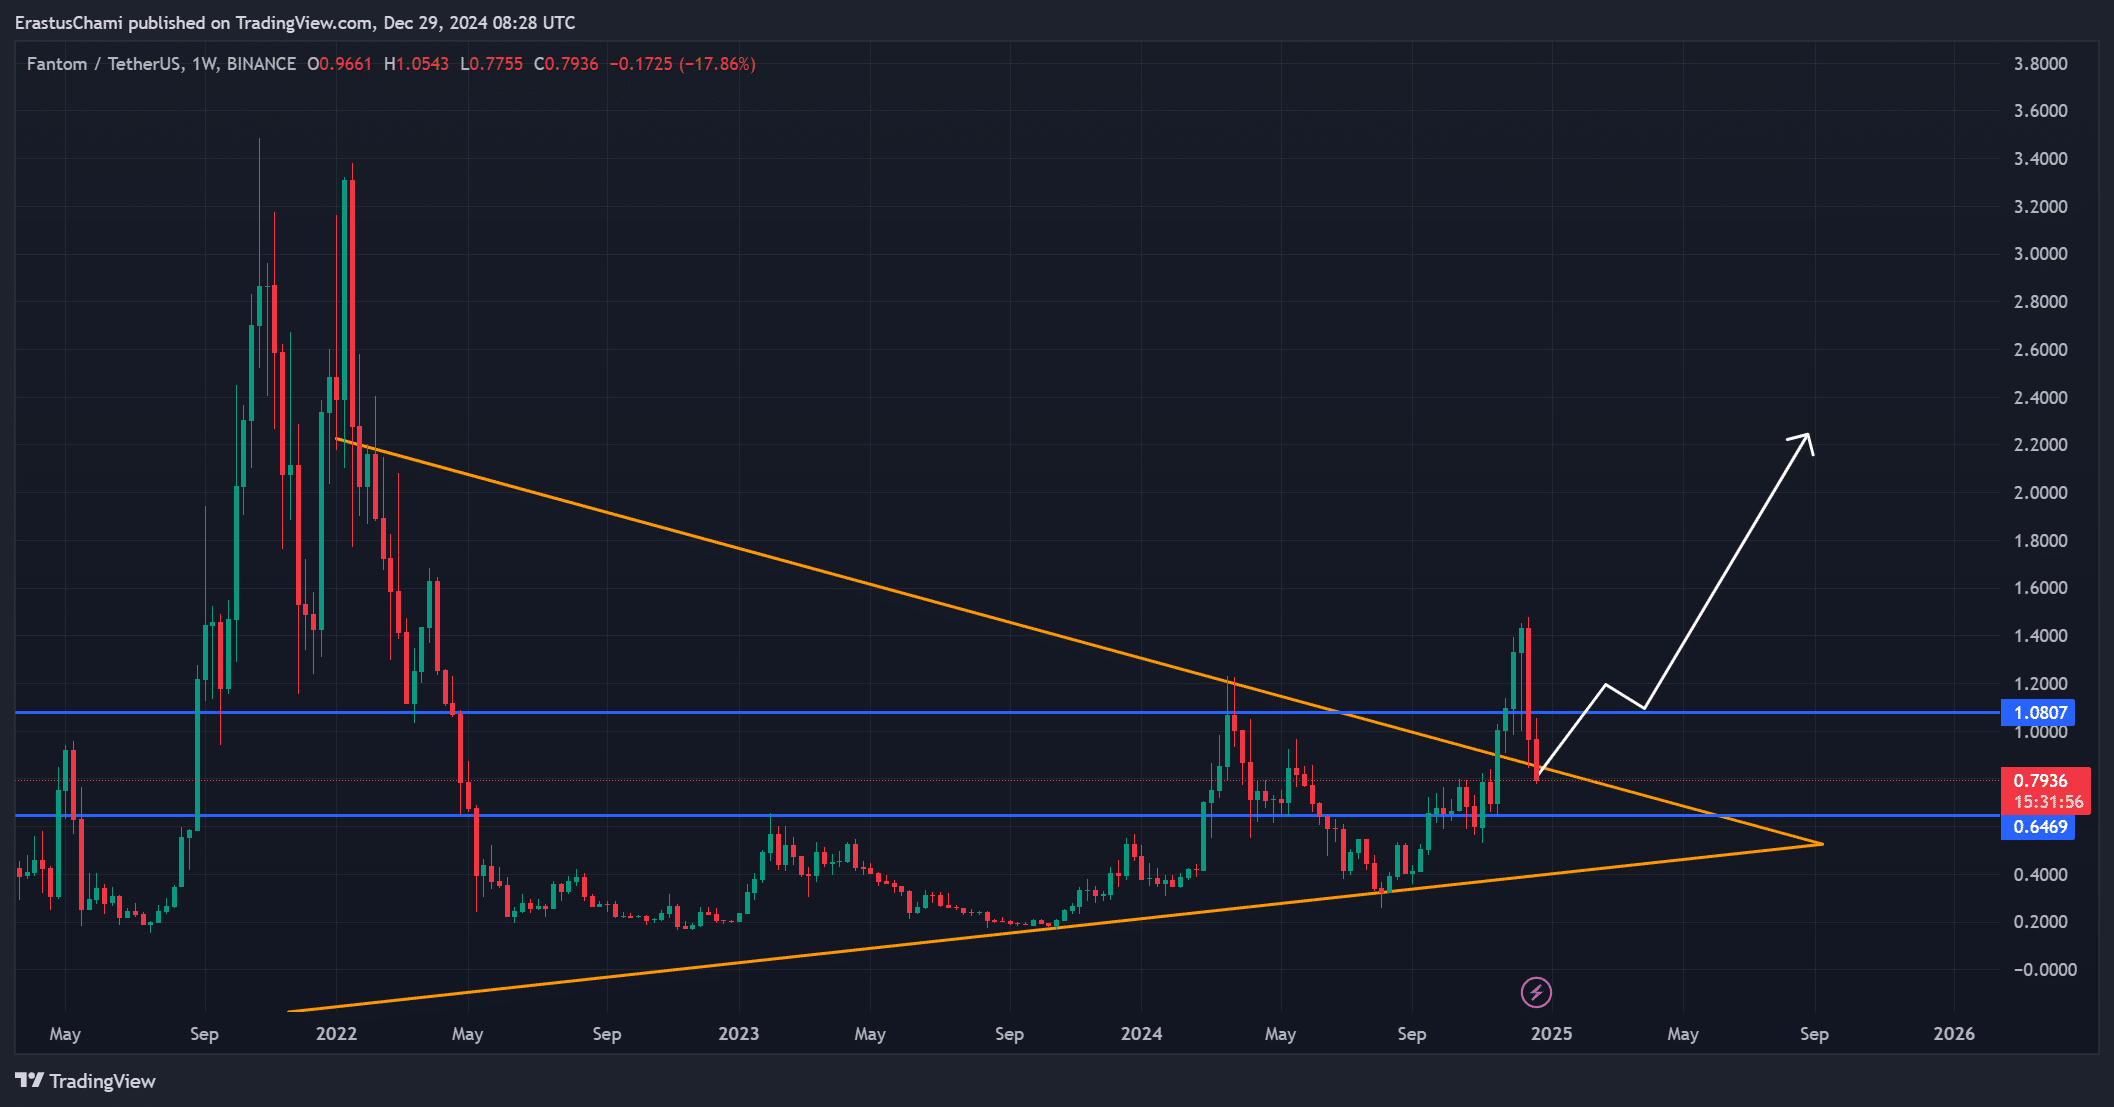
FTM price remained in a tight range, with critical support at $0.7316 and resistance at $0.9671. A break above this resistance could push the price towards $1.08, a level with significant psychological importance.
However, failure to maintain current support could lead to further losses. The descending triangle pattern visible on the charts suggests that a major price move could be imminent.
Therefore, the upcoming trading sessions could determine the near-term trajectory of FTM.
Source: TradingView
Does network activity portend a bullish future?
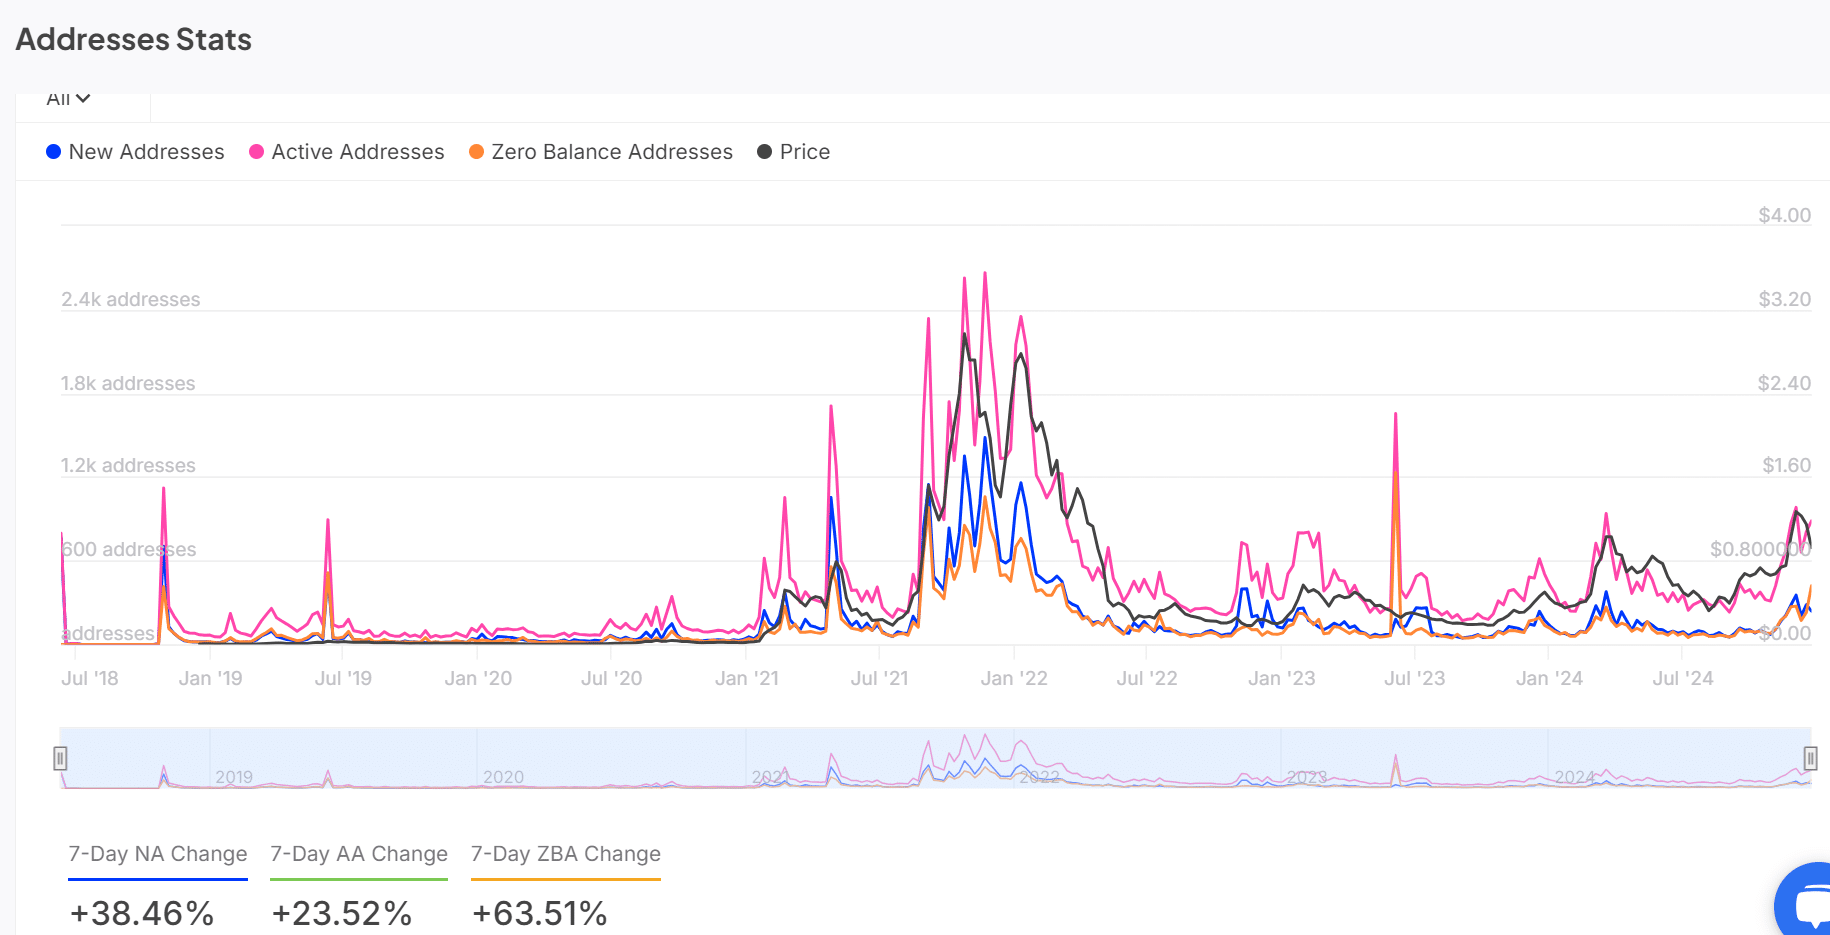
Fantom’s blockchain activity surged at press time, with new addresses up 38.46%, active addresses up 23.52%, and zero balance addresses up 63.51% as of during the last week.
This increase reflects growing interest and participation in the ecosystem, which could strengthen FTM’s long-term value.
However, while these numbers look promising, consistent growth will be key to maintaining the bullish momentum. Network activity therefore remains a key indicator to monitor.
Source: In the block
MVRV Ratio Signals Potential Undervaluation
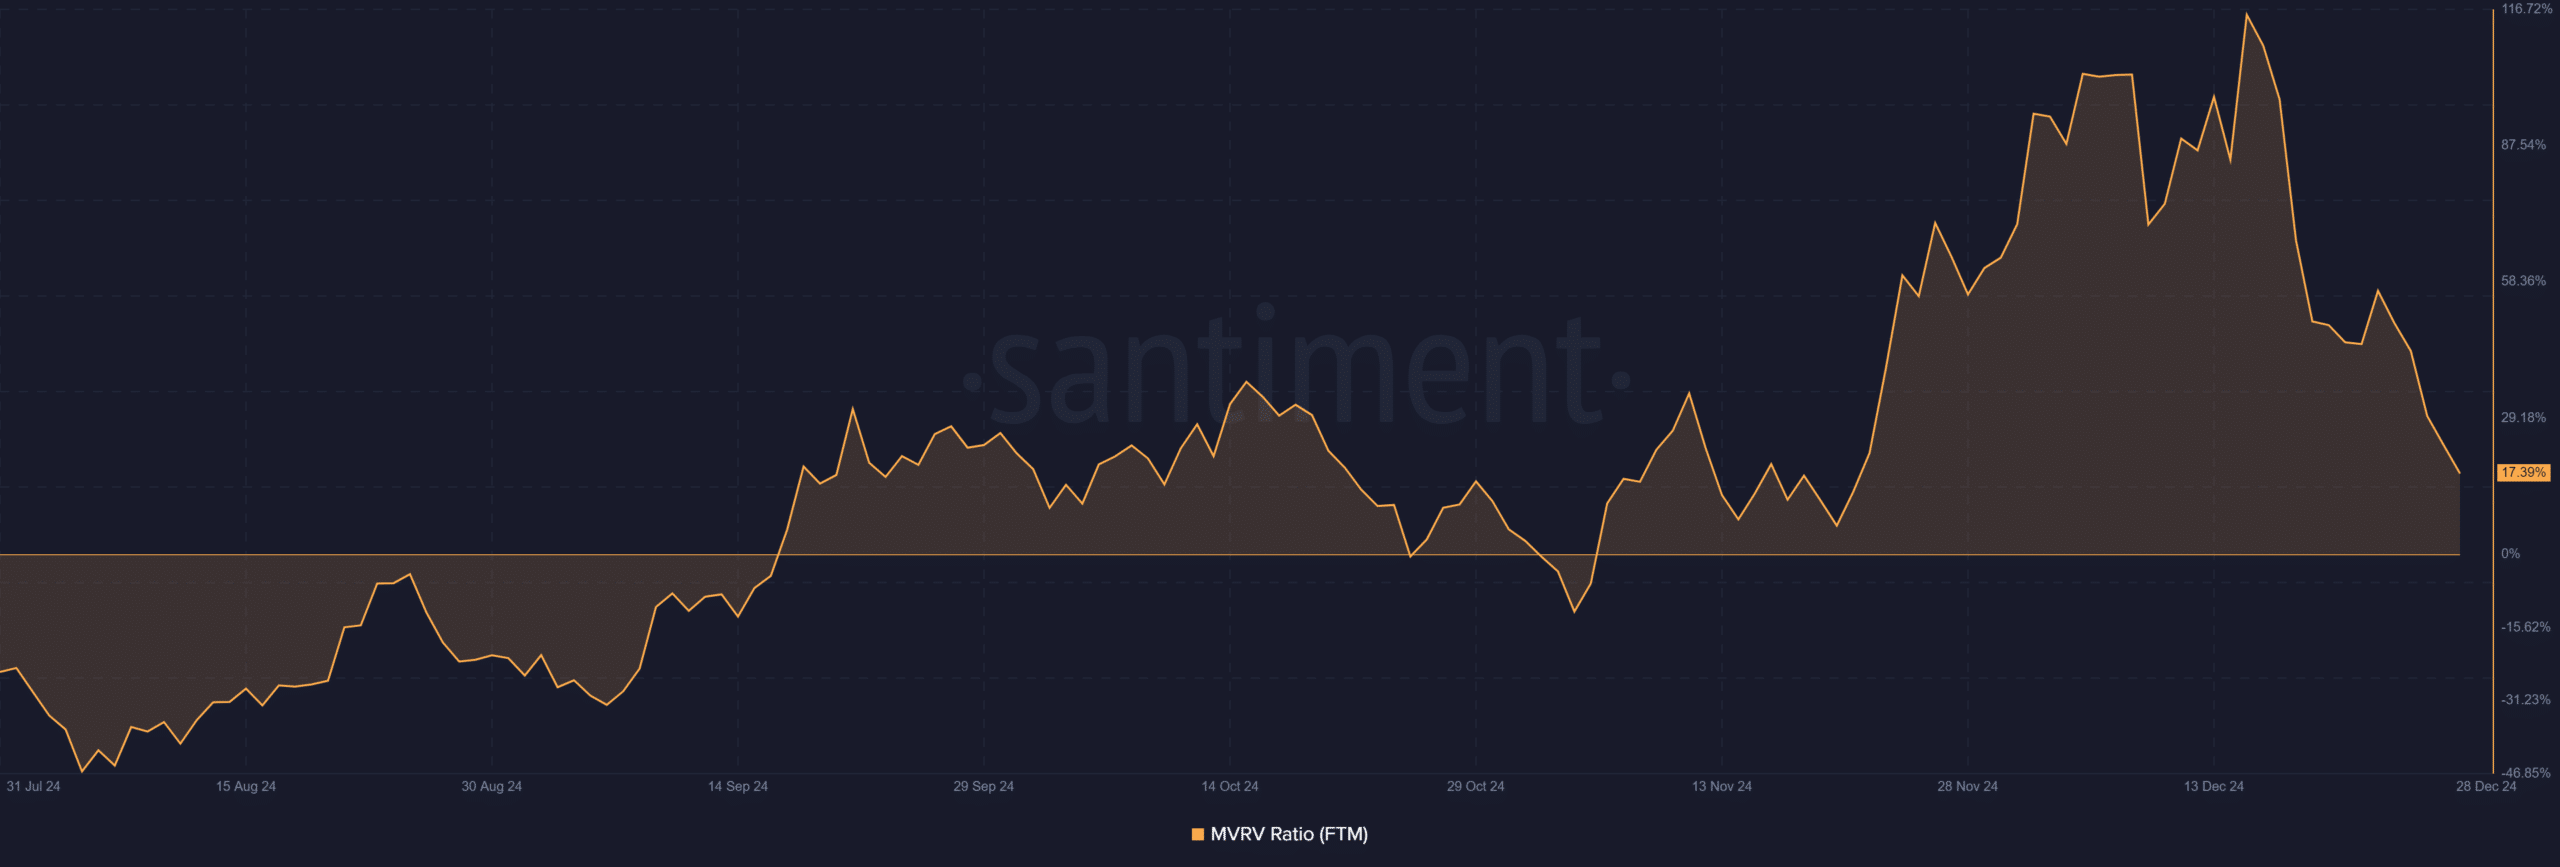
The market value to realized value ratio (MVRV) fell to 17.39%, highlighting reduced profitability for FTM holders.
Historically, such declines have preceded significant price movements, as they often indicate undervaluation.
This could attract buyers looking to take advantage of discounted prices. However, persistent selling pressure could also push prices lower. Traders should closely monitor sentiment to gauge the market’s next move.
Source: Santiment
Are technical indicators flashing like a reversal signal?
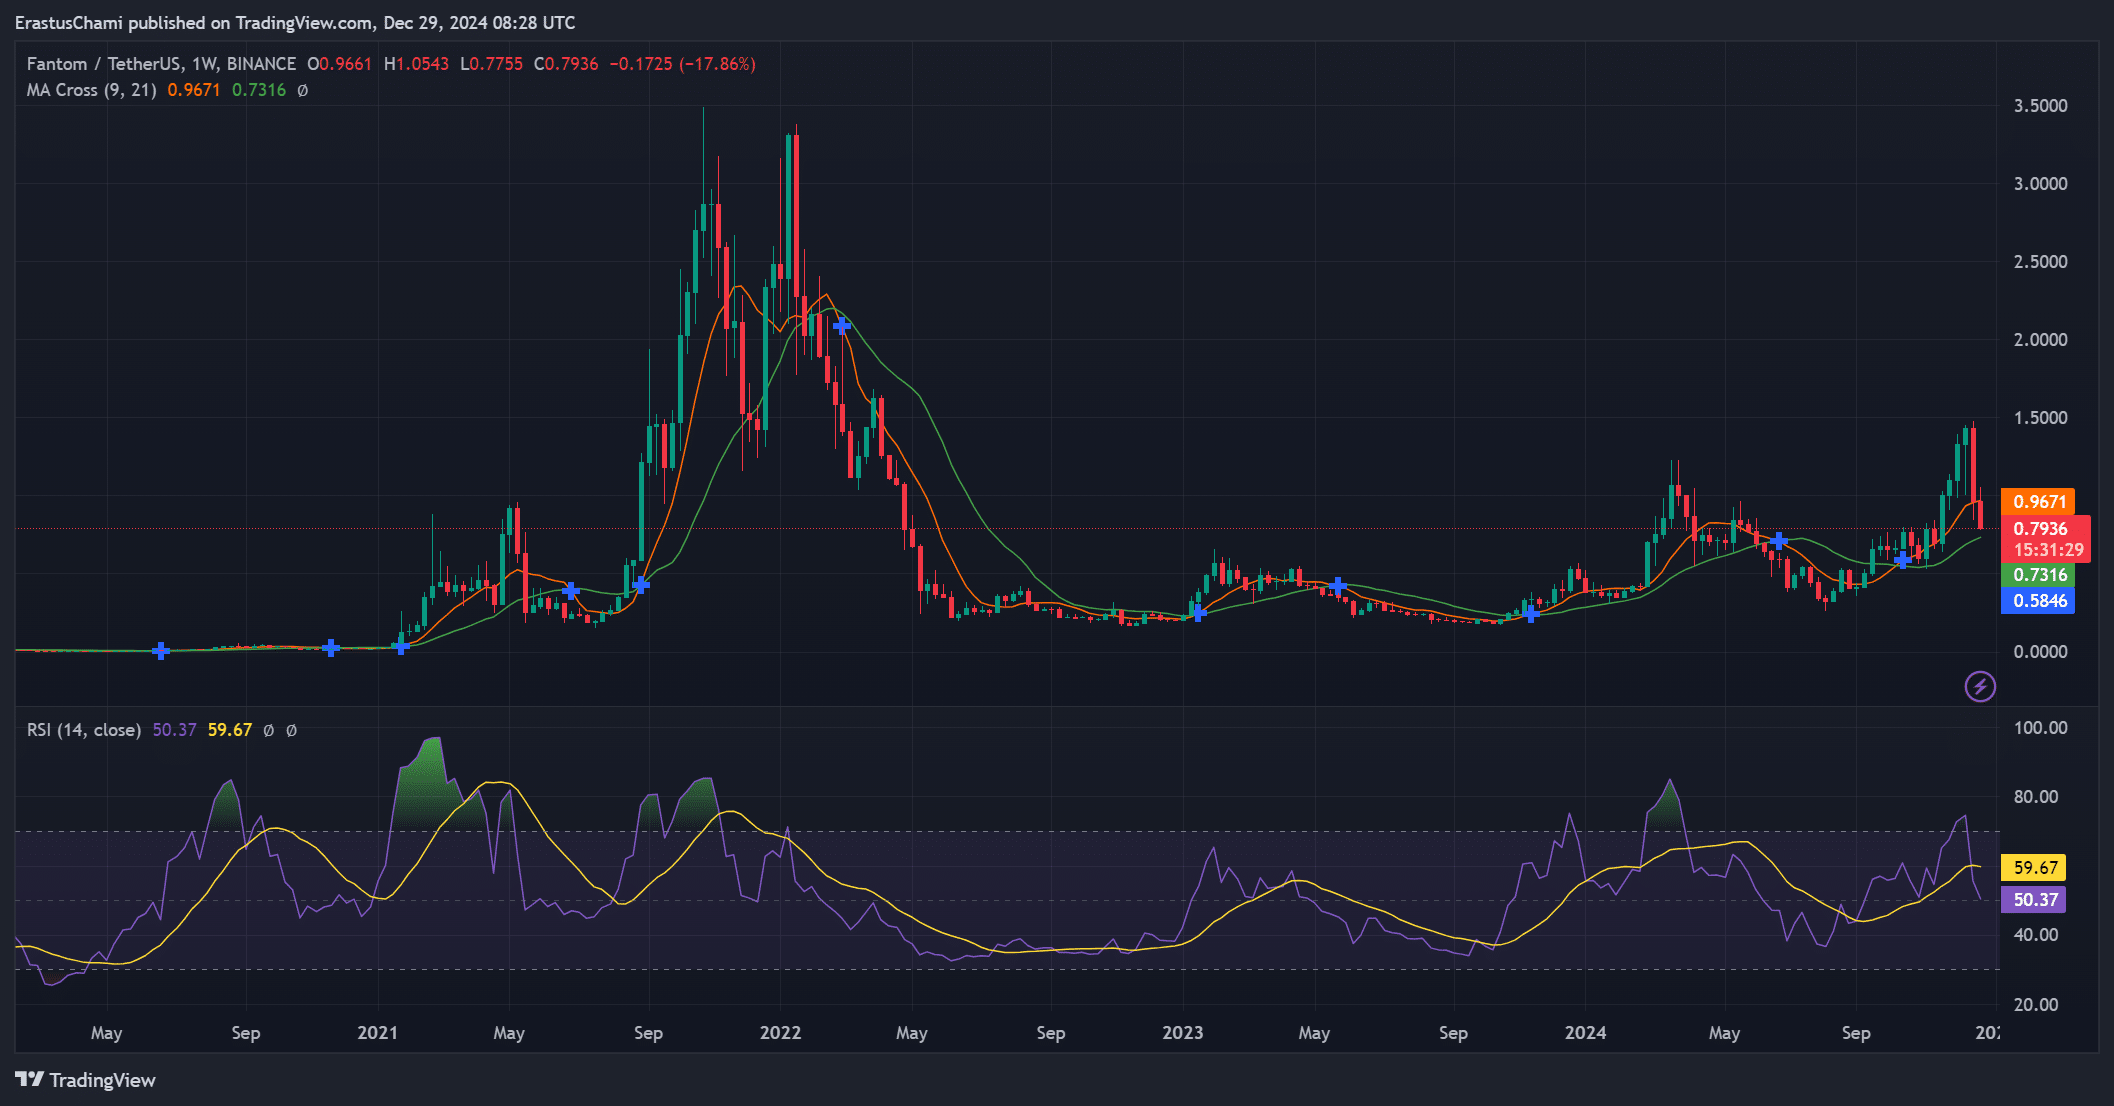
The relative strength index (RSI), at 50.37, indicated neutral momentum at press time, with a slight tilt towards a bullish recovery.
Meanwhile, the moving average crossover suggests potential volatility, as the short-term average moves closer to the long-term average.
Therefore, these indicators indicate a potential turning point for FTM price, making the next few days crucial for traders.
Source: TradingView
Liquidations suggest traders remain optimistic
Liquidation trends show $23.06k in short positions versus $98.22k in long positions, revealing bullish sentiment despite recent declines. This imbalance suggests that many traders are positioning for an upward price movement.
However, external market forces could still weigh on FTM’s performance. Therefore, liquidation data should be analyzed alongside other metrics for a more comprehensive view.

Source: Coinglass
Read Fantom (FTM) Price Prediction 2024-25
Increasing activity on the Fantom network, along with bullish liquidation trends and technical signals, suggest the potential for a price recovery.
However, the decline in MVRV ratio and resistance levels should be carefully monitored. If FTM maintains its network growth and exceeds key levels, a rally could materialize in the coming weeks.


