Why is Bitcoin falling? Panic has gripped the crypto market, but what can the latest Bitcoin technical analysis reveal about Bitcoin price right now as bears take control of BTC price action.
Good year! Bitcoin .cwp-coin-chart path svg { stroke: ; line width: ; }
Price
Trading volume in 24 hours
Last price movement over 7 days
came in like a beast, gaining 10% and immediately after losing 7%. Is the market still bullish or has the trend simply turned bearish? It was quite a start to the new year! Many overleveraged traders were wiped out – liquidated.
Others have suffered losses, and some are likely still holding onto their positions, believing the bullish thesis. Moves like these give good technical analysis data to look at, so let’s unpack them!
Bitcoin versus gold – rocket launch #5 delayed due to turbulence above launch site pic.twitter.com/TUpK6lR38t
– Northstar (@NorthstarCharts) January 8, 2025
DISCOVER: How to Buy Ethereum as a Beginner
Bitcoin technical analysis: bullish or bearish – to trade or not to trade

(BTC/USDT)
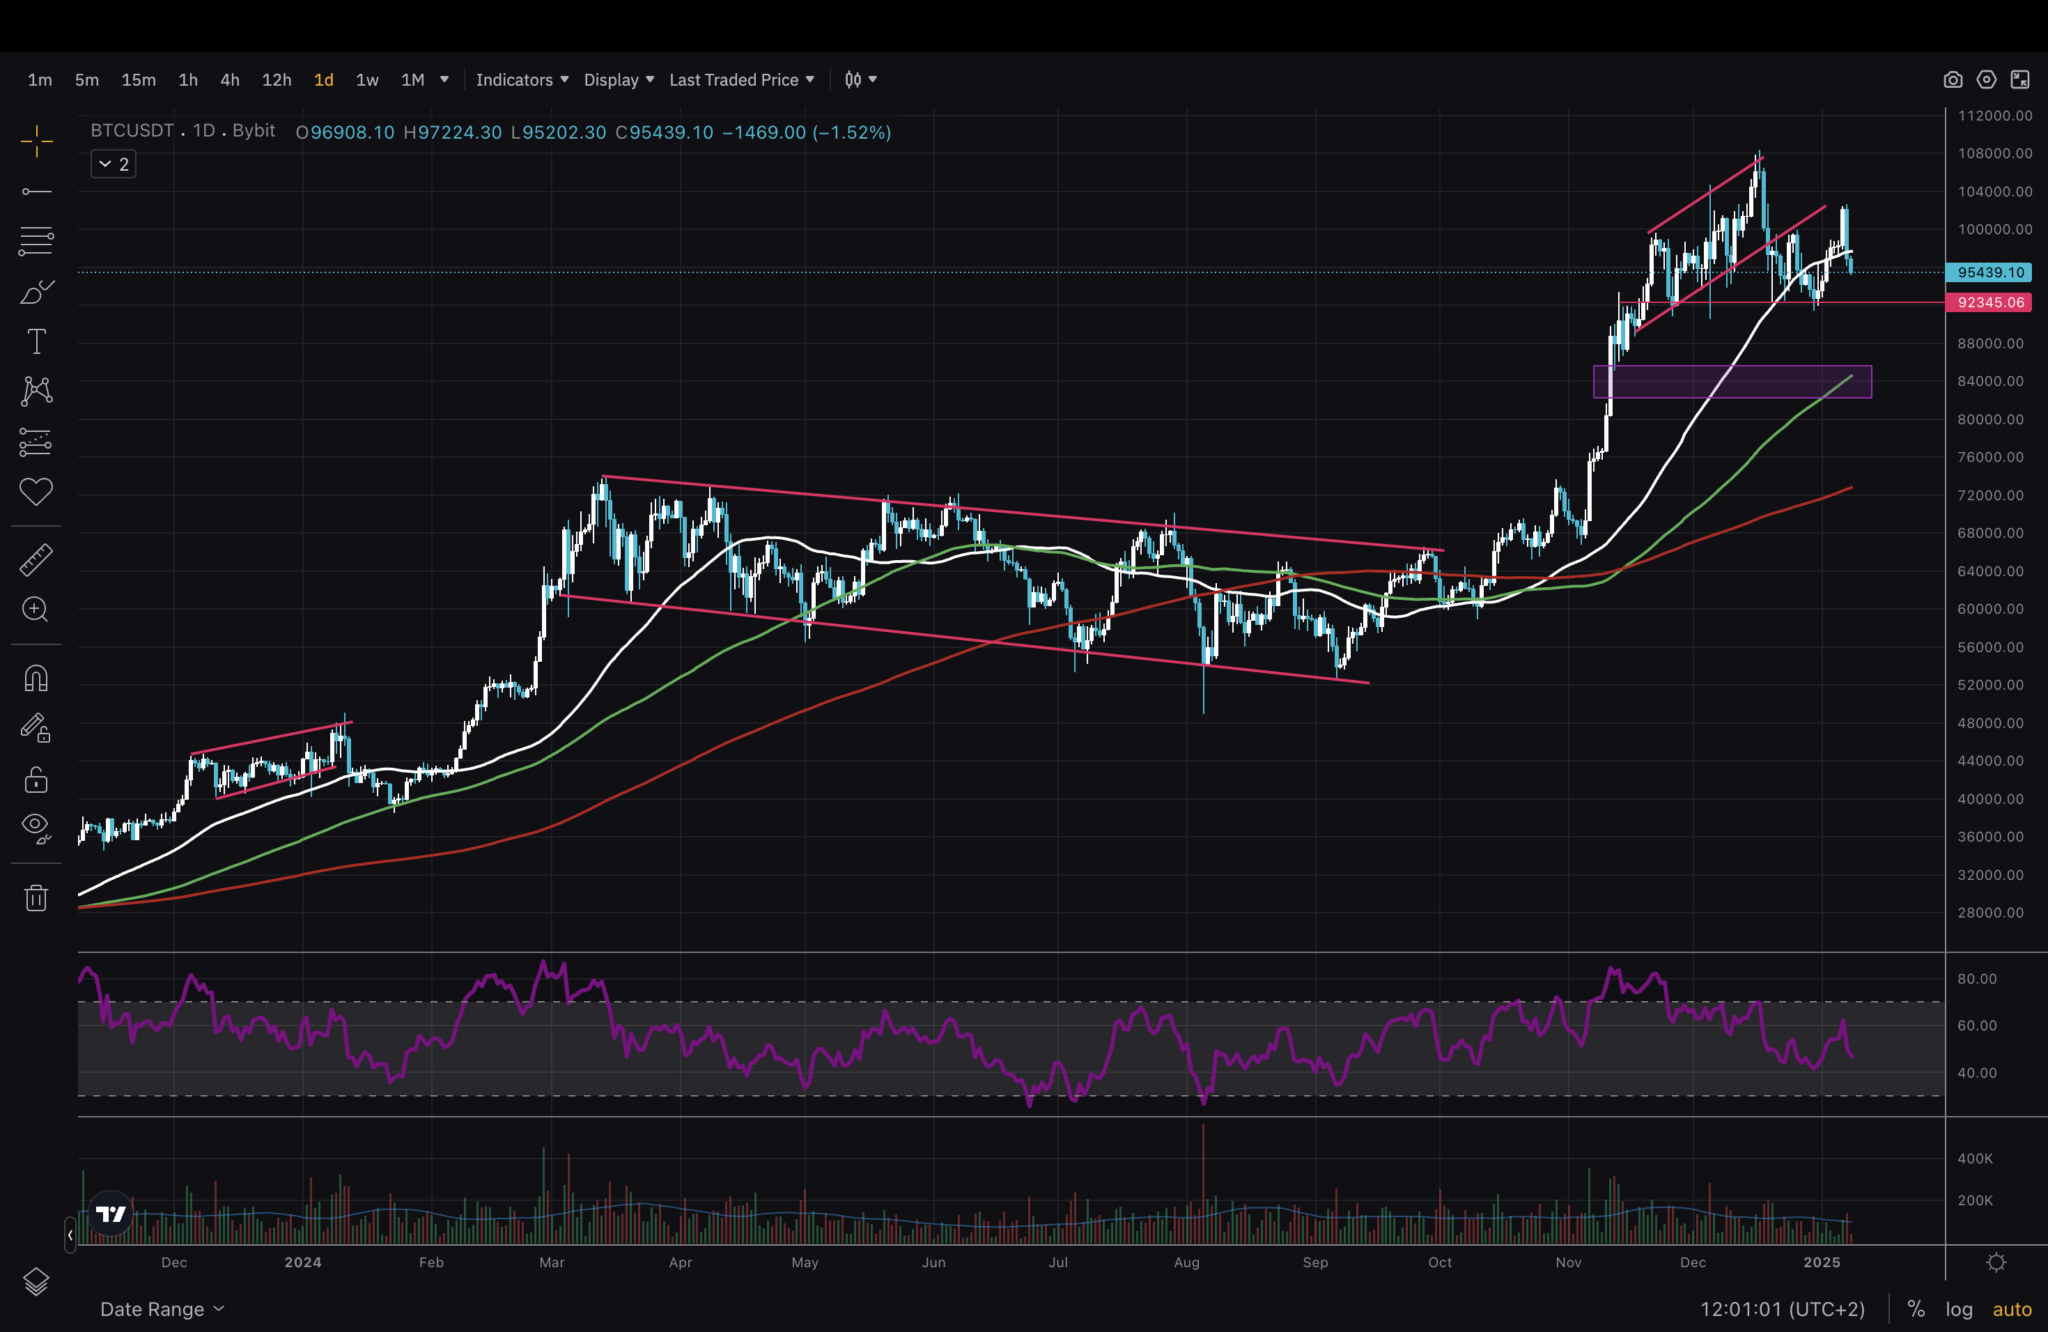
As usual when we perform technical analysis, we first look at the highest time frame – 1D. I deliberately zoomed out to December 2023, so we can see how similar a price pattern formed last month. Both Decembers formed ascending channels and both collapsed. And the 6 month descending channel between the two was a buildup that broke out to the upside.
I chose the purple box as my area of interest because it is untested territory. Since the price fell below the MA50 (white), this box aligns with the MA100 (green), from which the uptrend resumed in January 2024.

(BTC/USDT)
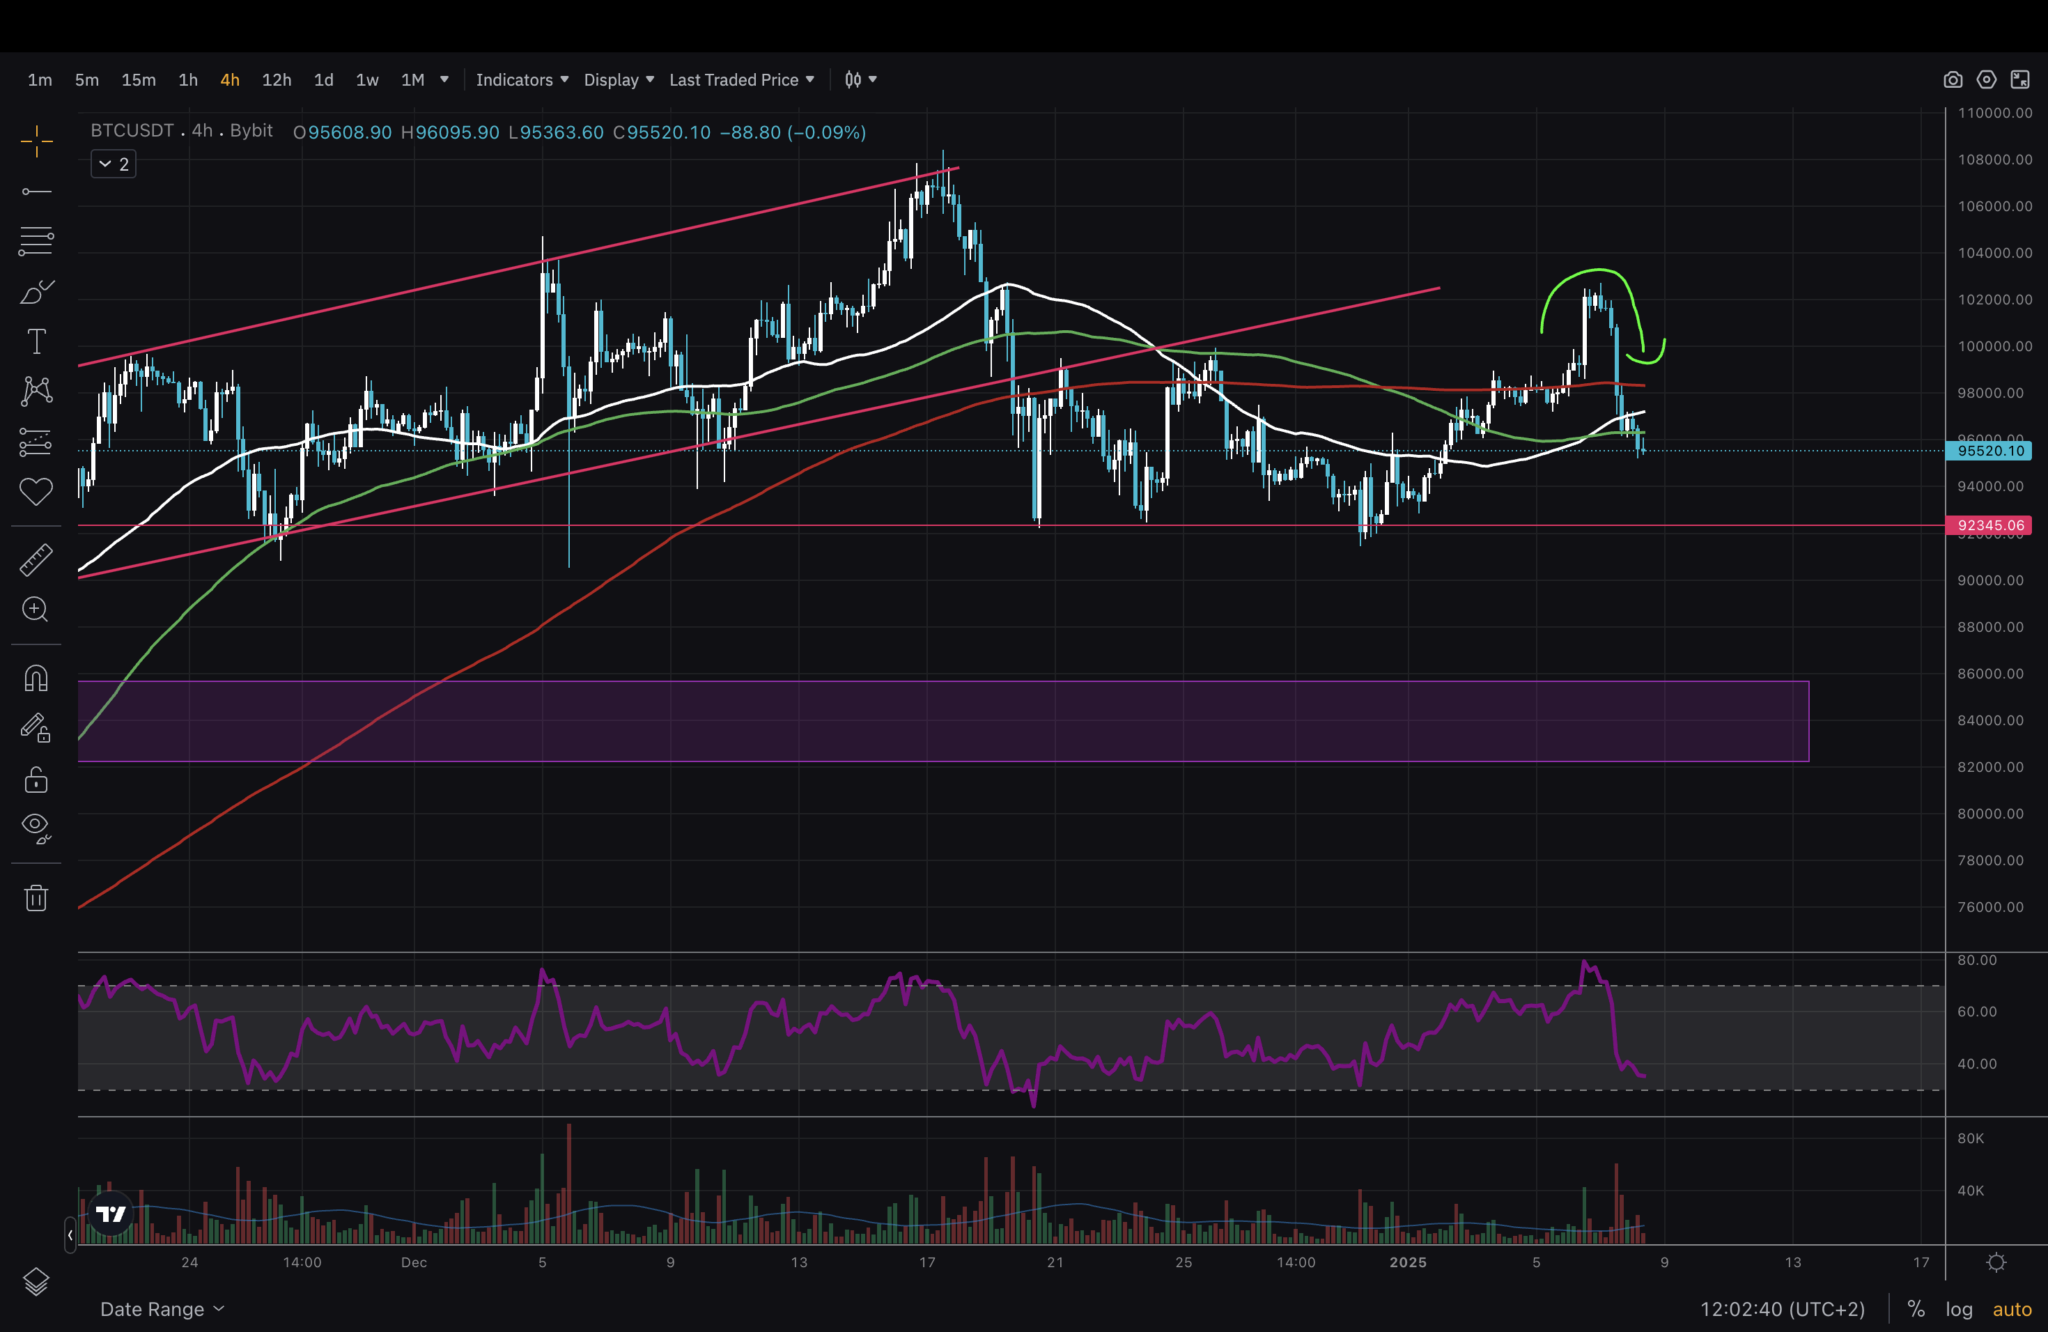
Moving to 4H, what immediately catches the eye is the strong rejection at $102,000 and a full pump retracement that we witnessed just two days ago. The bullish outlook quickly turned bearish.
Is it death for the bulls and victory for the bears? Looking closer we can see that there was a retracement of the trendline, which was a good trigger to enter a short position at around $99,000 and close with a good profit at the level support. Over this period, the price is now below all the MAs we monitor.
EXPLORE: the best Solana projects for 2025
 (BTC/USDT)
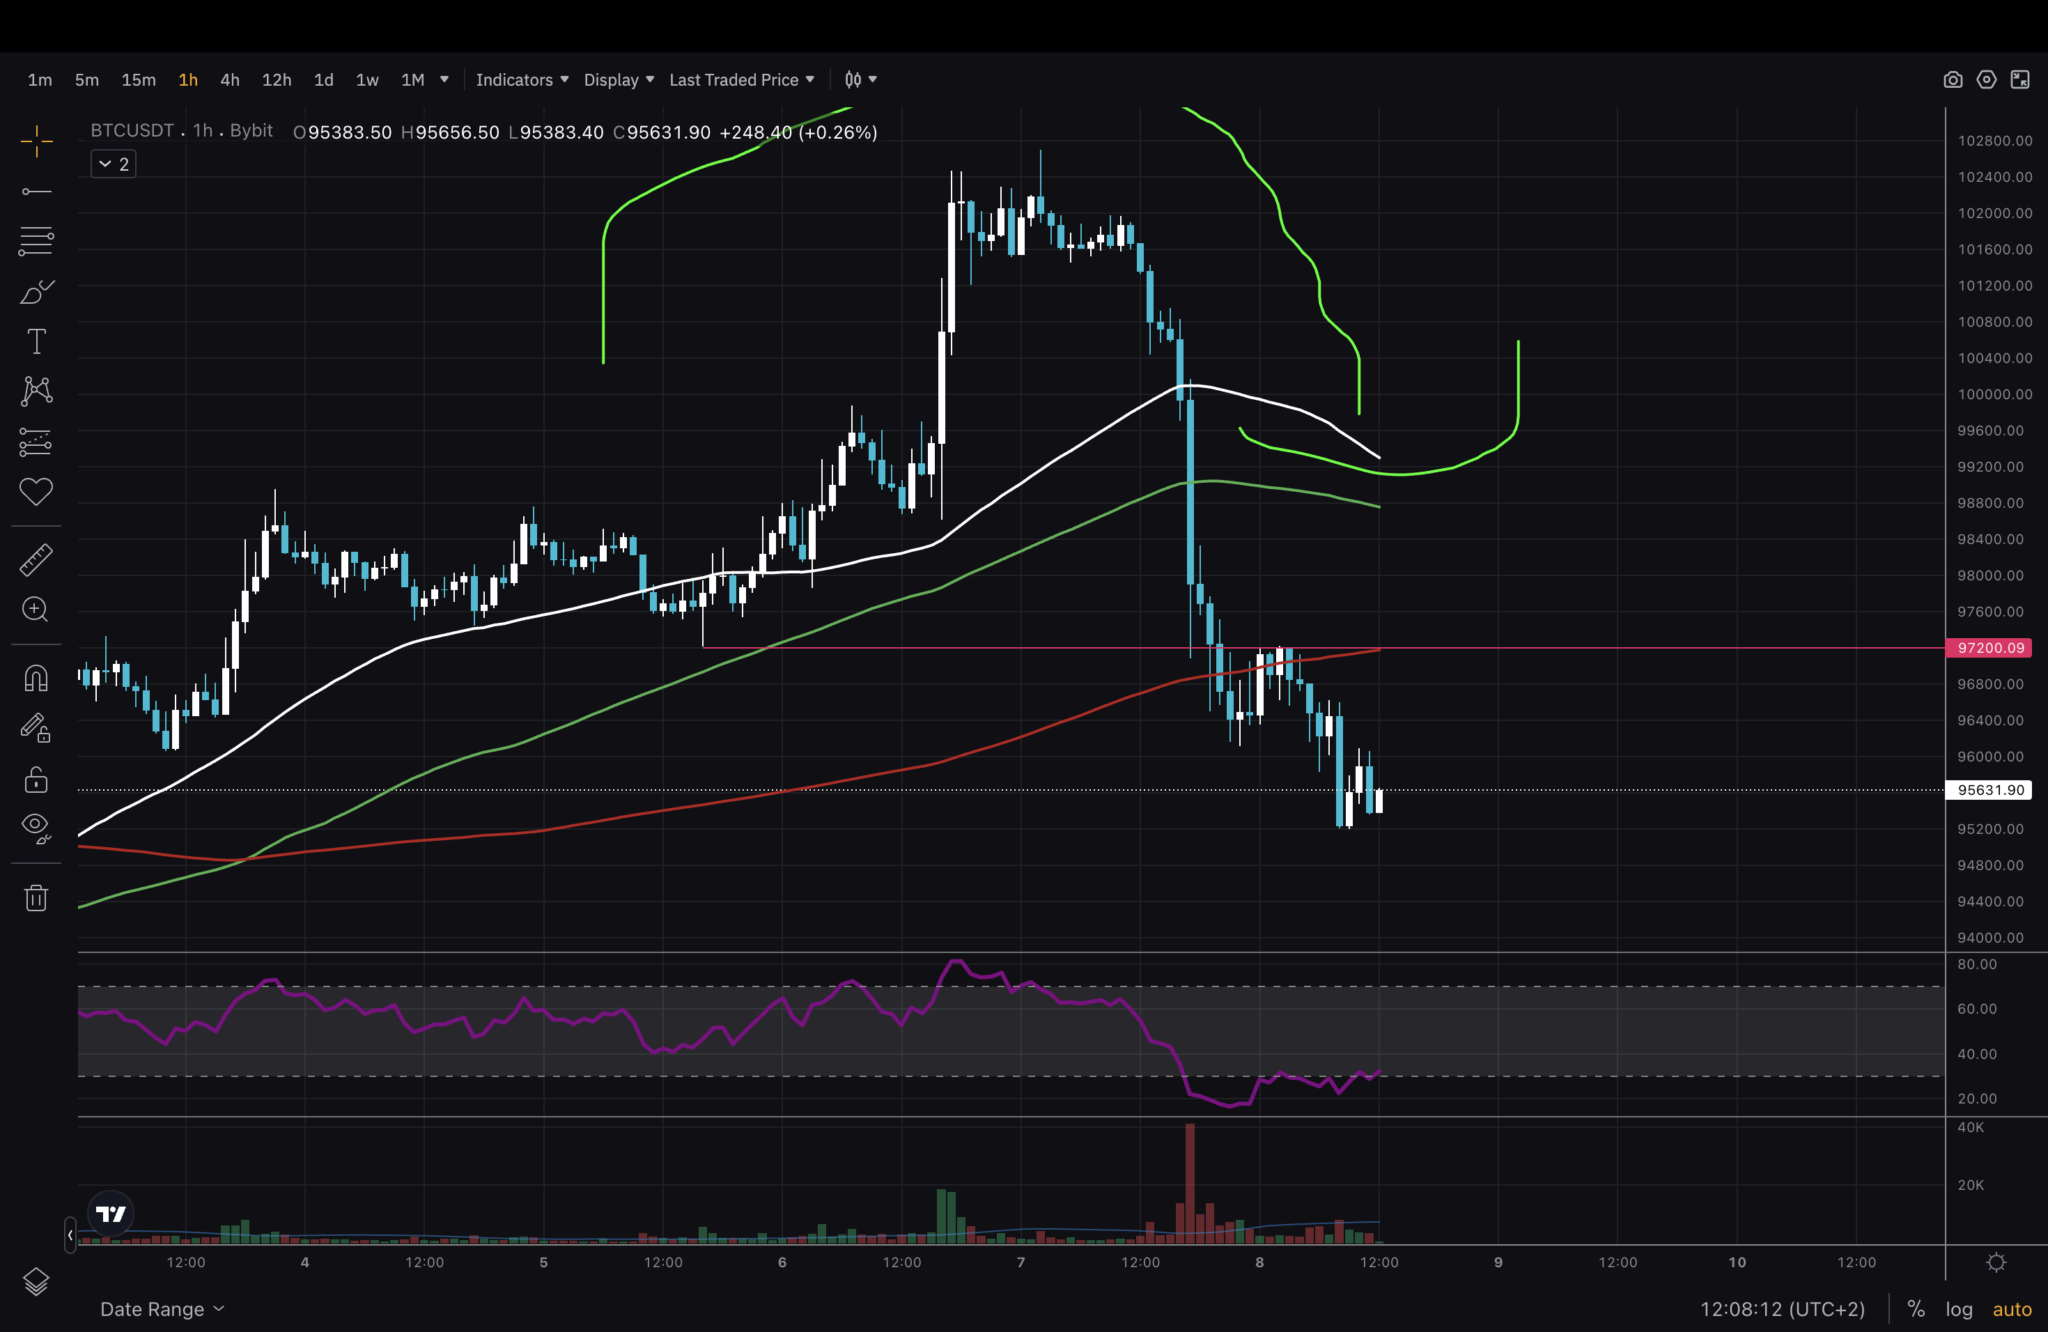
Last but not least – 1H. The bulls don’t like what’s happening here. This rapid sell-off/retracement of the pump looked promising until none of the AMs could act as support.
Even if the RSI shows a bullish divergence, it would be better to wait for the RSI to drop a bit on the higher time frames before entering long positions again. Or until we see the MAs recovered and retested. In the meantime, the bears are in control.
Final Thoughts on Bitcoin Technical Analysis
Personally, I would wait for the Bitcoin price to stabilize and find support – ideally around the levels I have indicated in the 1D chart. Finding a floor around $85,000 could become a solid base to launch the next leg.
Breaking below $68,000 would mean the uptrend is over. It’s a long way to go and it’s very unlikely that the price will go that low, given the constant inflows into ETFs. However, anything can happen in the markets, so always manage your risk and protect your capital!
EXPLORE: Elon Musk Bans Andrew Tate’s BRUV Party – What’s Next for ‘Vote Bruv?’ »
Join the 99Bitcoins News Discord here for the latest market updates
The article Why Bitcoin is falling: Bulls and bears clash over BTC price appeared first on 99Bitcoins.


