


Key points to remember:
-
ZEC’s 500% rally in October is fueled by celebrity support and short selloffs.
-
A rising wedge pattern now warns of a potential 30% correction towards the $260-$270 support zone in November.
Zcash ![]() ZECUSD is spooking cryptocurrency bears this Halloween as it is one of the few coins to post significant gains on Friday.
ZECUSD is spooking cryptocurrency bears this Halloween as it is one of the few coins to post significant gains on Friday.
The privacy-focused cryptocurrency rose 7.75% to $390.75, its highest level since 2018. In comparison, the crypto market cap fell 2.50% during the same period.
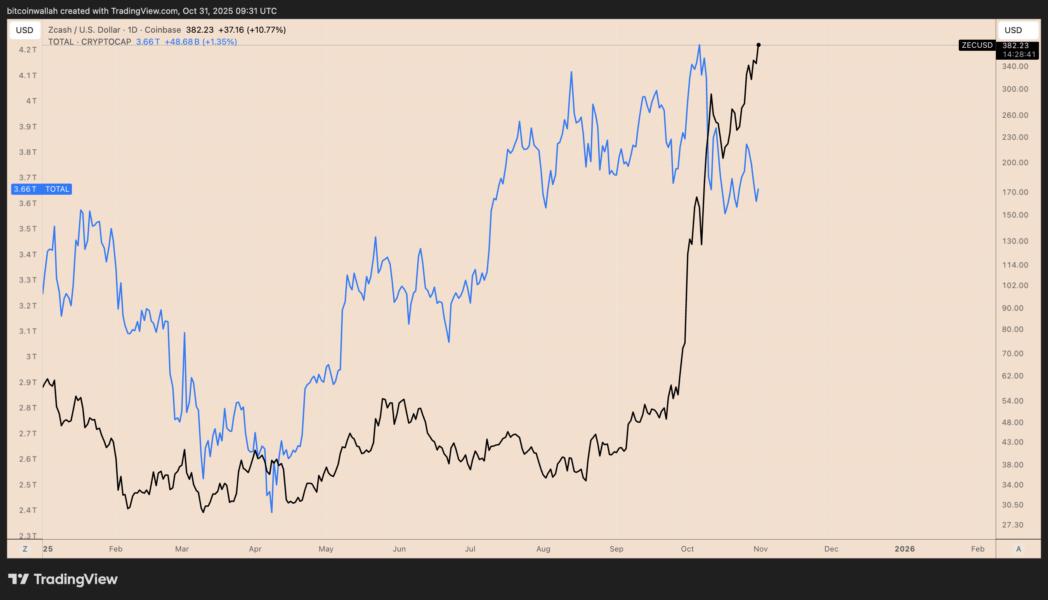
ZEC price increased by almost 500% in October, contrasting with the crypto market’s 4.50% loss.
What is behind the monstrous return of Zcash?
Crypto Celebrities Pump ZEC Price
High-profile endorsements energized ZEC’s bullish narrative.
The price of Zcash began to rise after renowned investor Naval Ravikant called it “insurance against Bitcoin” in an October 1 article. It jumped more than 60% on the day and has since continued its upward momentum.
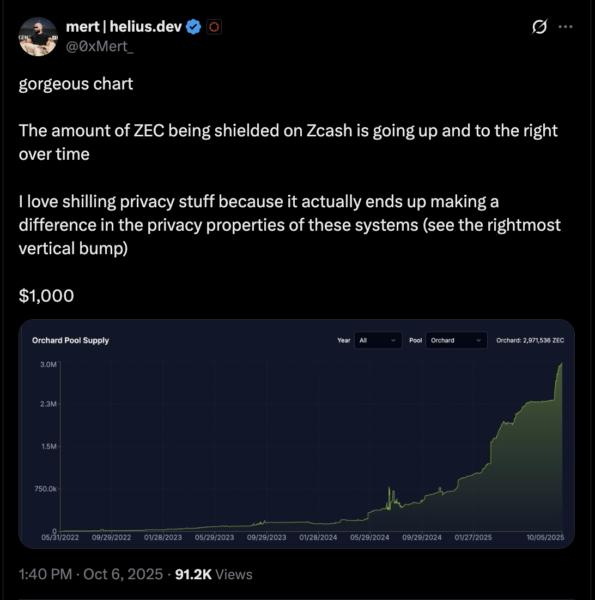
Mert Mumtaz, co-founder and CEO of Solana-focused development company Helius, publicly launched a $1,000 target, bringing Zcash into the social spotlight and enticing traders to get involved.
Most recently, Arthur Hayes, co-founder of BitMEX, fueled the ZEC uptrend with a $10,000 call, leading to a 30% rise in the price of ZEC.
These pumps are similar to what Dogecoin ![]() DOGEUSD market experienced in 2021. The memecoin jumped on average by 33% following Elon Musk’s posts in its favor, according to researcher Dabian Fablander.
DOGEUSD market experienced in 2021. The memecoin jumped on average by 33% following Elon Musk’s posts in its favor, according to researcher Dabian Fablander.
ZEC Short Liquidations Fuel Rally
Short liquidations added fuel to Zcash’s price surge.
ZEC futures have seen nearly $65 million in cumulative liquidations over the past two weeks, more than half of which came from short positions, according to CoinGlass estimates.
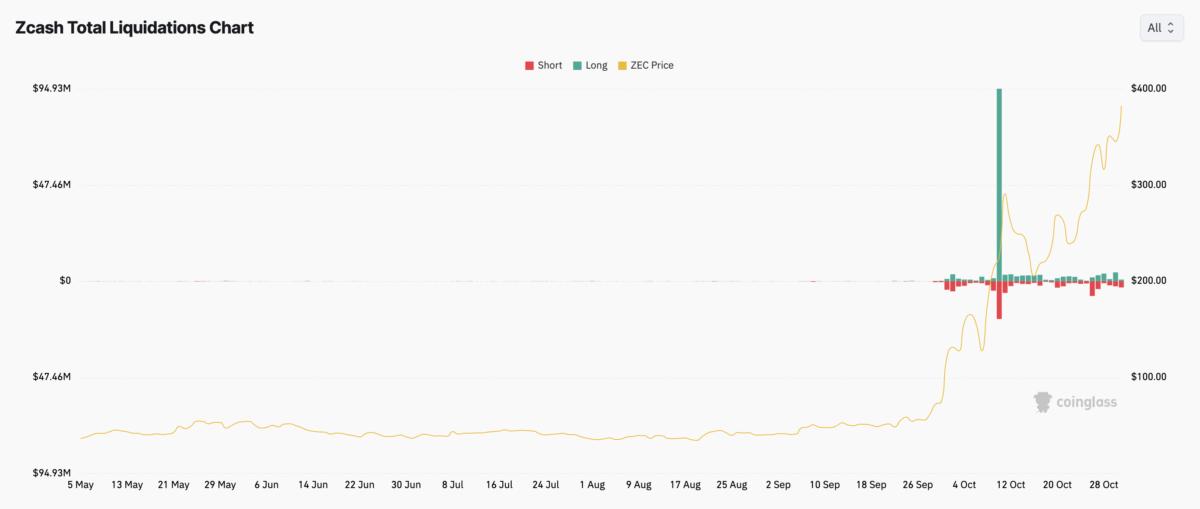
This imbalance suggests that ZEC’s breakout was driven by a classic short squeeze, in which traders betting against the private coin were forced to close their positions as prices rose.
Retail FOMO is adding fuel to the upside, as evidenced by internet search spikes for the keyword “Zcash” throughout October, particularly around pump days.

The feedback loop of liquidation-triggered buying, coupled with persistent FOMO among retail traders, helped sustain the rally well beyond its initial catalyst.
ZEC technical data suggests 30% correction
On the daily chart, ZEC forms an ascending wedge, a trend often preceding bearish reversals after prolonged uptrends.
The upper boundary of the wedge currently sits near $450, suggesting that ZEC could still move towards this high before the momentum fades.
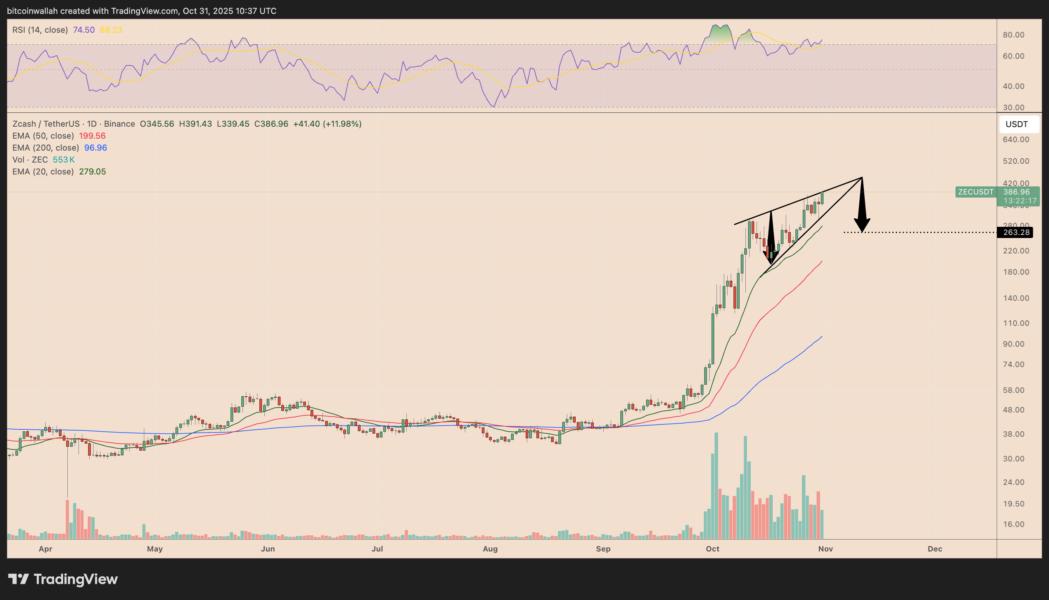
However, a bearish divergence between the token’s rising price and falling RSI readings (currently near 74), coupled with falling trading volumes, suggests that buying strength is waning.
The trend could confirm a 30% decline towards the $260-$270 zone in November if sellers push ZEC below the wedge’s lower trendline.
The $260-$270 area aligns with the 20-day exponential moving average (20-day EMA, represented by the green wave).
This article does not contain investment advice or recommendations. Every investment and trading move involves risk, and readers should conduct their own research before making a decision.