


")
The price of Bitcoin is dead. Again. At least that’s what the iconic Rainbow Chart indicates in the form .cwp-coin-chart svg path { Stroke-width: 0.65 !important; } .cwp-coin-widget-container .cwp-graph-container.positive svg path: nth-of-type (2) { trait: #008868 !important; } .cwp-coin-widget-container .cwp-coin-trend.positive { color: #008868 !important; background-color: transparent !important; } .cwp-coin-widget-container .cwp-coin-popup-holder .cwp-coin-trend.positive { border: 1px solid #008868; border-radius: 3px; } .cwp-coin-widget-container .cwp-coin-trend.positive::before { border-bottom: 4px solid #008868 !important; } .cwp-coin-widget-container .cwp-coin-price-holder .cwp-coin-trend-holder .cwp-trend { background-color: transparent !important; } .cwp-coin-widget-container .cwp-graph-container.negative svg path: nth-of-type (2) { trait: #A90C0C !important; } .cwp-coin-widget-container .cwp-coin-popup-holder .cwp-coin-trend.negative { border: 1px solid #A90C0C; border-radius: 3px; } .cwp-coin-widget-container .cwp-coin-trend.negative { color: #A90C0C !important; background-color: transparent !important; } .cwp-coin-widget-container .cwp-coin-trend.negative::before { border-top: 4px solid #A90C0C !important; }
![]()
Bitcoin
3.62%
![]()
Bitcoin
BTC
Price
$71,133.08
3.62% /24h
Volume in 24 hours
$66.07 billion
Price 7d
// Make SVG responsive jQuery (document). svg.attr(‘viewBox’, ‘0 0 ‘ + originalWidth + ‘ ‘ + originalHeight); } svg.removeAttr(‘width’).removeAttr(‘height’); } });
Learn more
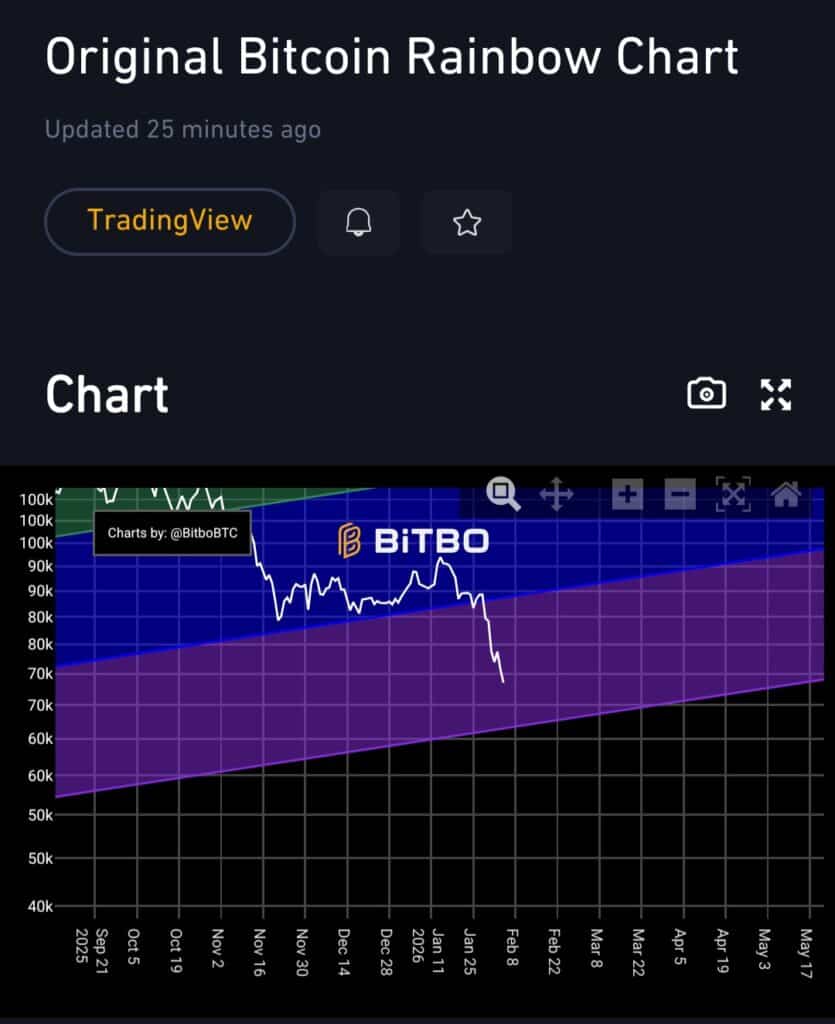
in early February 2026, it is drifting near $72,000, below its recent high of $78,725.
Cryptocurrency sentiment on Twitter now rivals the desperation seen after FTX’s 2022 collapse, with many saying this halving cycle has already failed.
The rainbow card bends more and more every year. If we still used the OG chart from 2016, the price would be well below the actual rainbow; originally, BTC was now in the $1,000,000+ range.
Thanks, Rainbowman, I’ve racked up lots over 100,000 because this chart told me so. And now ? They should display a rainbow touching Earth.
The Rainbow Chart tracks Bitcoin against emotional bands ranging from “Bitcoin is Dead” to “Bubble Territory.” The chart records 457 Bitcoin obituaries since 2010. It’s not predictive, it’s psychological. Purple and blue mean surrender. Orange and red mean mania.
Here are the other two factors why many are saying this bear market is only just beginning:
DISCOVER: 20+ next cryptos that will explode in 2026
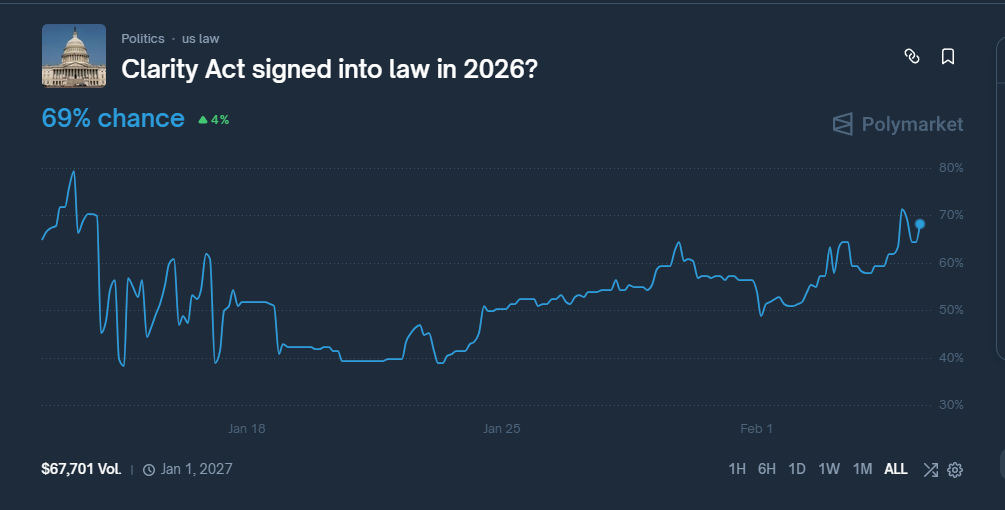
1. Emergency Clarity Act talks fail amid accusations against Trump and UAE
Crypto policy just became a criminal investigation.
New York Senator Chris Murphy accused Trump of “potentially criminal conduct”, with the UAE pumping money into the Trump family’s crypto businesses through World Liberty Financial and then overseeing the immediate approval of crypto legislation.
According to a Wall Street Journal report, approximately $187 million was paid to Trump family entities and another $31 million to special envoy Steve Witkoff’s family.
Murphy cited a $500 million deal in which UAE-backed Aryam Investment acquired 49% of World Liberty Financial four days before Trump took office, describing the sequence as a classic quid pro quo.
“This is corruption. These are the elements of a bribe. This is potentially criminal conduct.” -Chris Murphy, U.S. Senator, remarks on the Senate floor
Crypto Twitter wonders if Democrats hate crypto more than Trump; he’s just trying to take advantage of it for as long as he can. He was never really pro crypto.
The accusations surfaced as the White House held a closed-door crypto summit with Ripple, Coinbase, Kraken, Tether and Circle, attempting to hammer out stablecoin yield provisions related to the CLARITY Act.
No agreement has been reached, but the February deadline is now looming.
DISCOVER: Top 20 cryptocurrencies to buy in 2026
2. Are the bears right? Crypto supercyclists down sharply in 2026
Some traders see more disadvantages. Crypto trader Rektmando says Bitcoin lacks structural support until the mid-to-low $60,000 range, with others pointing to $67,000 as a possible cycle floor.
The pressure is not limited to Bitcoin. Ethereum has fallen sharply above $3,000, with a large leveraged position reportedly at risk of liquidation near $1,800.
Seasoned investor Michael Burry added fuel by sharing a Bitcoin logarithmic chart suggesting a topping pattern similar to previous cycle peaks.
$BTC Patterns pic.twitter.com/Ax595mNXrD
– Unleashed Cassandra (@michaeljburry) February 4, 2026
DISCOVER: Next 1000X Crypto: 10+ Crypto Tokens That Could Reach 1000x in 2026
Is Noah’s Ark Washing Coming? What the data really says
Bitcoin has fallen 17.5% to 20% year-to-date in early February 2026, from $87,500 to $70,000. Rising Treasury yields are crushing risk assets across the board.
Meanwhile, supercyclists like Raoul Pal, Arthur Hayes and Tom Lee continue to claim new all-time highs even after being completely wrong. The area between $67,000 and $70,000 is critical. Go below and $60,000 comes quickly.
Until the hopium dies, the fall continues. Remember that after the flood, it is the rainbow.
EXPLORE: Is Ethereum Dying, or Is This the Biggest Buy Signal of the Decade?
Follow 99Bitcoins on X for the latest market updates and subscribe on YouTube for daily market analysis from experts
Key takeaways
-
The price of Bitcoin is dead. Again. At least that’s what the iconic Rainbow Chart signals as prices climb around $72,000.
-
Meanwhile, supercyclists like Raoul Pal, Arthur Hayes and Tom Lee continue to claim new all-time highs even after being completely wrong.
The article Why Bitcoin Price is in Danger, Explained with Rainbows (41) appeared first on 99Bitcoins.