Close Menu
Altcoin ObserverAltcoin Observer
  • Regulation
  • Bitcoin
  • Altcoins
  • Market
  • Analysis
  • DeFi
  • Security
  • Ethereum
Categories
  • Altcoins (1,146)
  • Analysis (1,348)
  • Bitcoin (1,922)
  • Blockchain (1,113)
  • DeFi (1,319)
  • Ethereum (1,314)
  • Event (48)
  • Exclusive Deep Dive (1)
  • Landscape Ads (2)
  • Market (1,360)
  • Reddit (573)
  • Regulation (1,265)
  • Security (1,817)
  • Thought Leadership (1)
  • Uncategorized (3)
  • Videos (39)
Hand picked
  • FTX missed out on $500 million after selling Anysphere’s Cursor AI stake for just $200K
  • The US-Uk Trade Agreement Pushes Bitcoin on 100k, ETH and Pepe Soar
  • Trader says that the market has prepared a strong reversal after a bull movement – here is its target for Ethereum and Altcoins
  • VP JD Vance joins the Bitcoin 2025 conference as a star speaker
  • NFT sales jump + 40% in the last 24 hours – are NFT back?
We are social
  • Facebook
  • Twitter
  • Instagram
  • YouTube
Facebook X (Twitter) Instagram
  • About us
  • Disclaimer
  • Terms of service
  • Privacy policy
  • Contact us
Facebook X (Twitter) Instagram YouTube LinkedIn
Altcoin ObserverAltcoin Observer
  • Regulation
  • Bitcoin
  • Altcoins
  • Market
  • Analysis
  • DeFi
  • Security
  • Ethereum
Events
Altcoin ObserverAltcoin Observer
Home»Bitcoin»Will Bitcoin Real Price Drop to $31,000? Levels to Watch
Bitcoin

Will Bitcoin Real Price Drop to $31,000? Levels to Watch

September 13, 2024No Comments4 Mins Read
Share Facebook Twitter Pinterest LinkedIn Tumblr Reddit Telegram Email
Btc Webp 19 1000x600.webp.webp
Share
Facebook Twitter LinkedIn Pinterest Email


  • BTC has fallen below its 200-day moving average for the second time, the first being in July 2024.
  • One analyst predicted a drop in the realized price of BTC to $31,500.

Bitcoin (BTC) has seen extreme volatility over the past few months. Since hitting a local high of $70,016 in July, it has failed to maintain upward momentum. In fact, over the past month, it has fallen by 4.63%.

However, over the past week, BTC has attempted to reverse the trend by increasing by 4.16% per week. Despite these attempts, it has failed to maintain its momentum.

At the time of writing, BTC was trading at $58,093, down 0.40% from the previous day.

Similarly, the cryptocurrency’s trading volume fell by 19.90% to $29.7 billion in the last 24 hours.

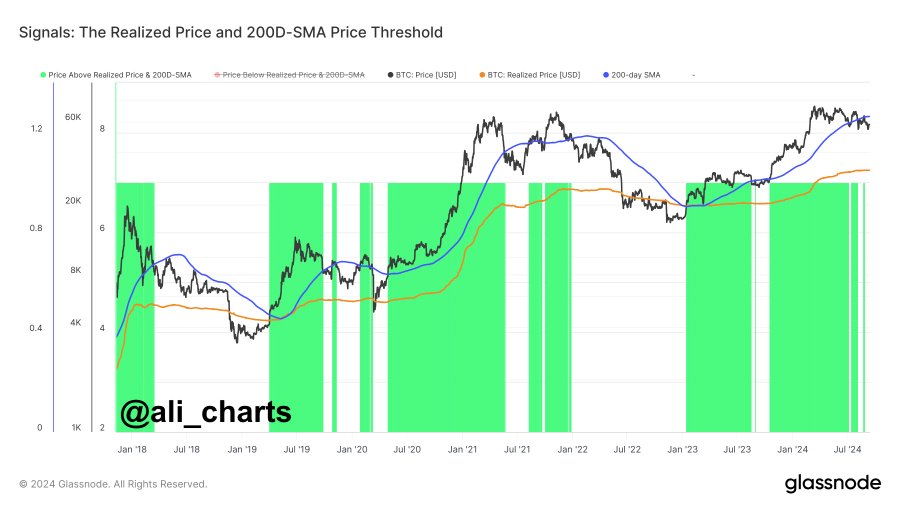
This market indecision and lack of a clear trajectory has led market analysts to anticipate a further decline before a reversal. To the extent that popular Crypto analyst Ali Martinez has predicted a decline in its realized price by citing its 200-day moving average

Market sentiment

According to his analysis, when Bitcoin trades above its 200-day moving average, it indicates strong returns. However, when it falls below this level, it sends the cryptocurrency into a sustained decline.

Source: Ali on X

Therefore, given that it has been trading below $64,000 over the past month, this suggested a potential decline to its realized price of $31,500.

In this context, when BTC markets are trading below the 200-day moving average, they are said to be in a downtrend. On the other hand, when they are trading above the 200-day moving average, they are said to be bullish.

Historically, when BTC falls below its 200-day moving average, prices tend to decline shortly after. First, during the 2016-2017 bull market, BTC fell below the 200-day moving average for three consecutive months.

During the 2018-2019 cycle, it fell below the 200-day moving average in mid-2019 before COVID-19 disrupted the trend. In August 2023, it fell below the 200-day moving average through October, which was accompanied by a decline in prices.

Recently, on July 4, BTC fell 2% to trade at $57,300, falling below its 200-day moving average of $58,720.

However, when BTC breaks above this trendline, prices tend to surge. For example, in October 2023, when prices broke above the 200-day moving average, BTC was trading at $28,000.

A breakout from this trendline fueled expectations for the ETF, paving the way for an ATH of $73,737. In July, when it broke above the trendline, its prices recovered to $70,016.

What Bitcoin Charts Indicate

Certainly, as Martinez argued, a drop below the 200-day moving average indicated a decline, based on historical data. But what do the other indicators say?

Source: CryptoQuant

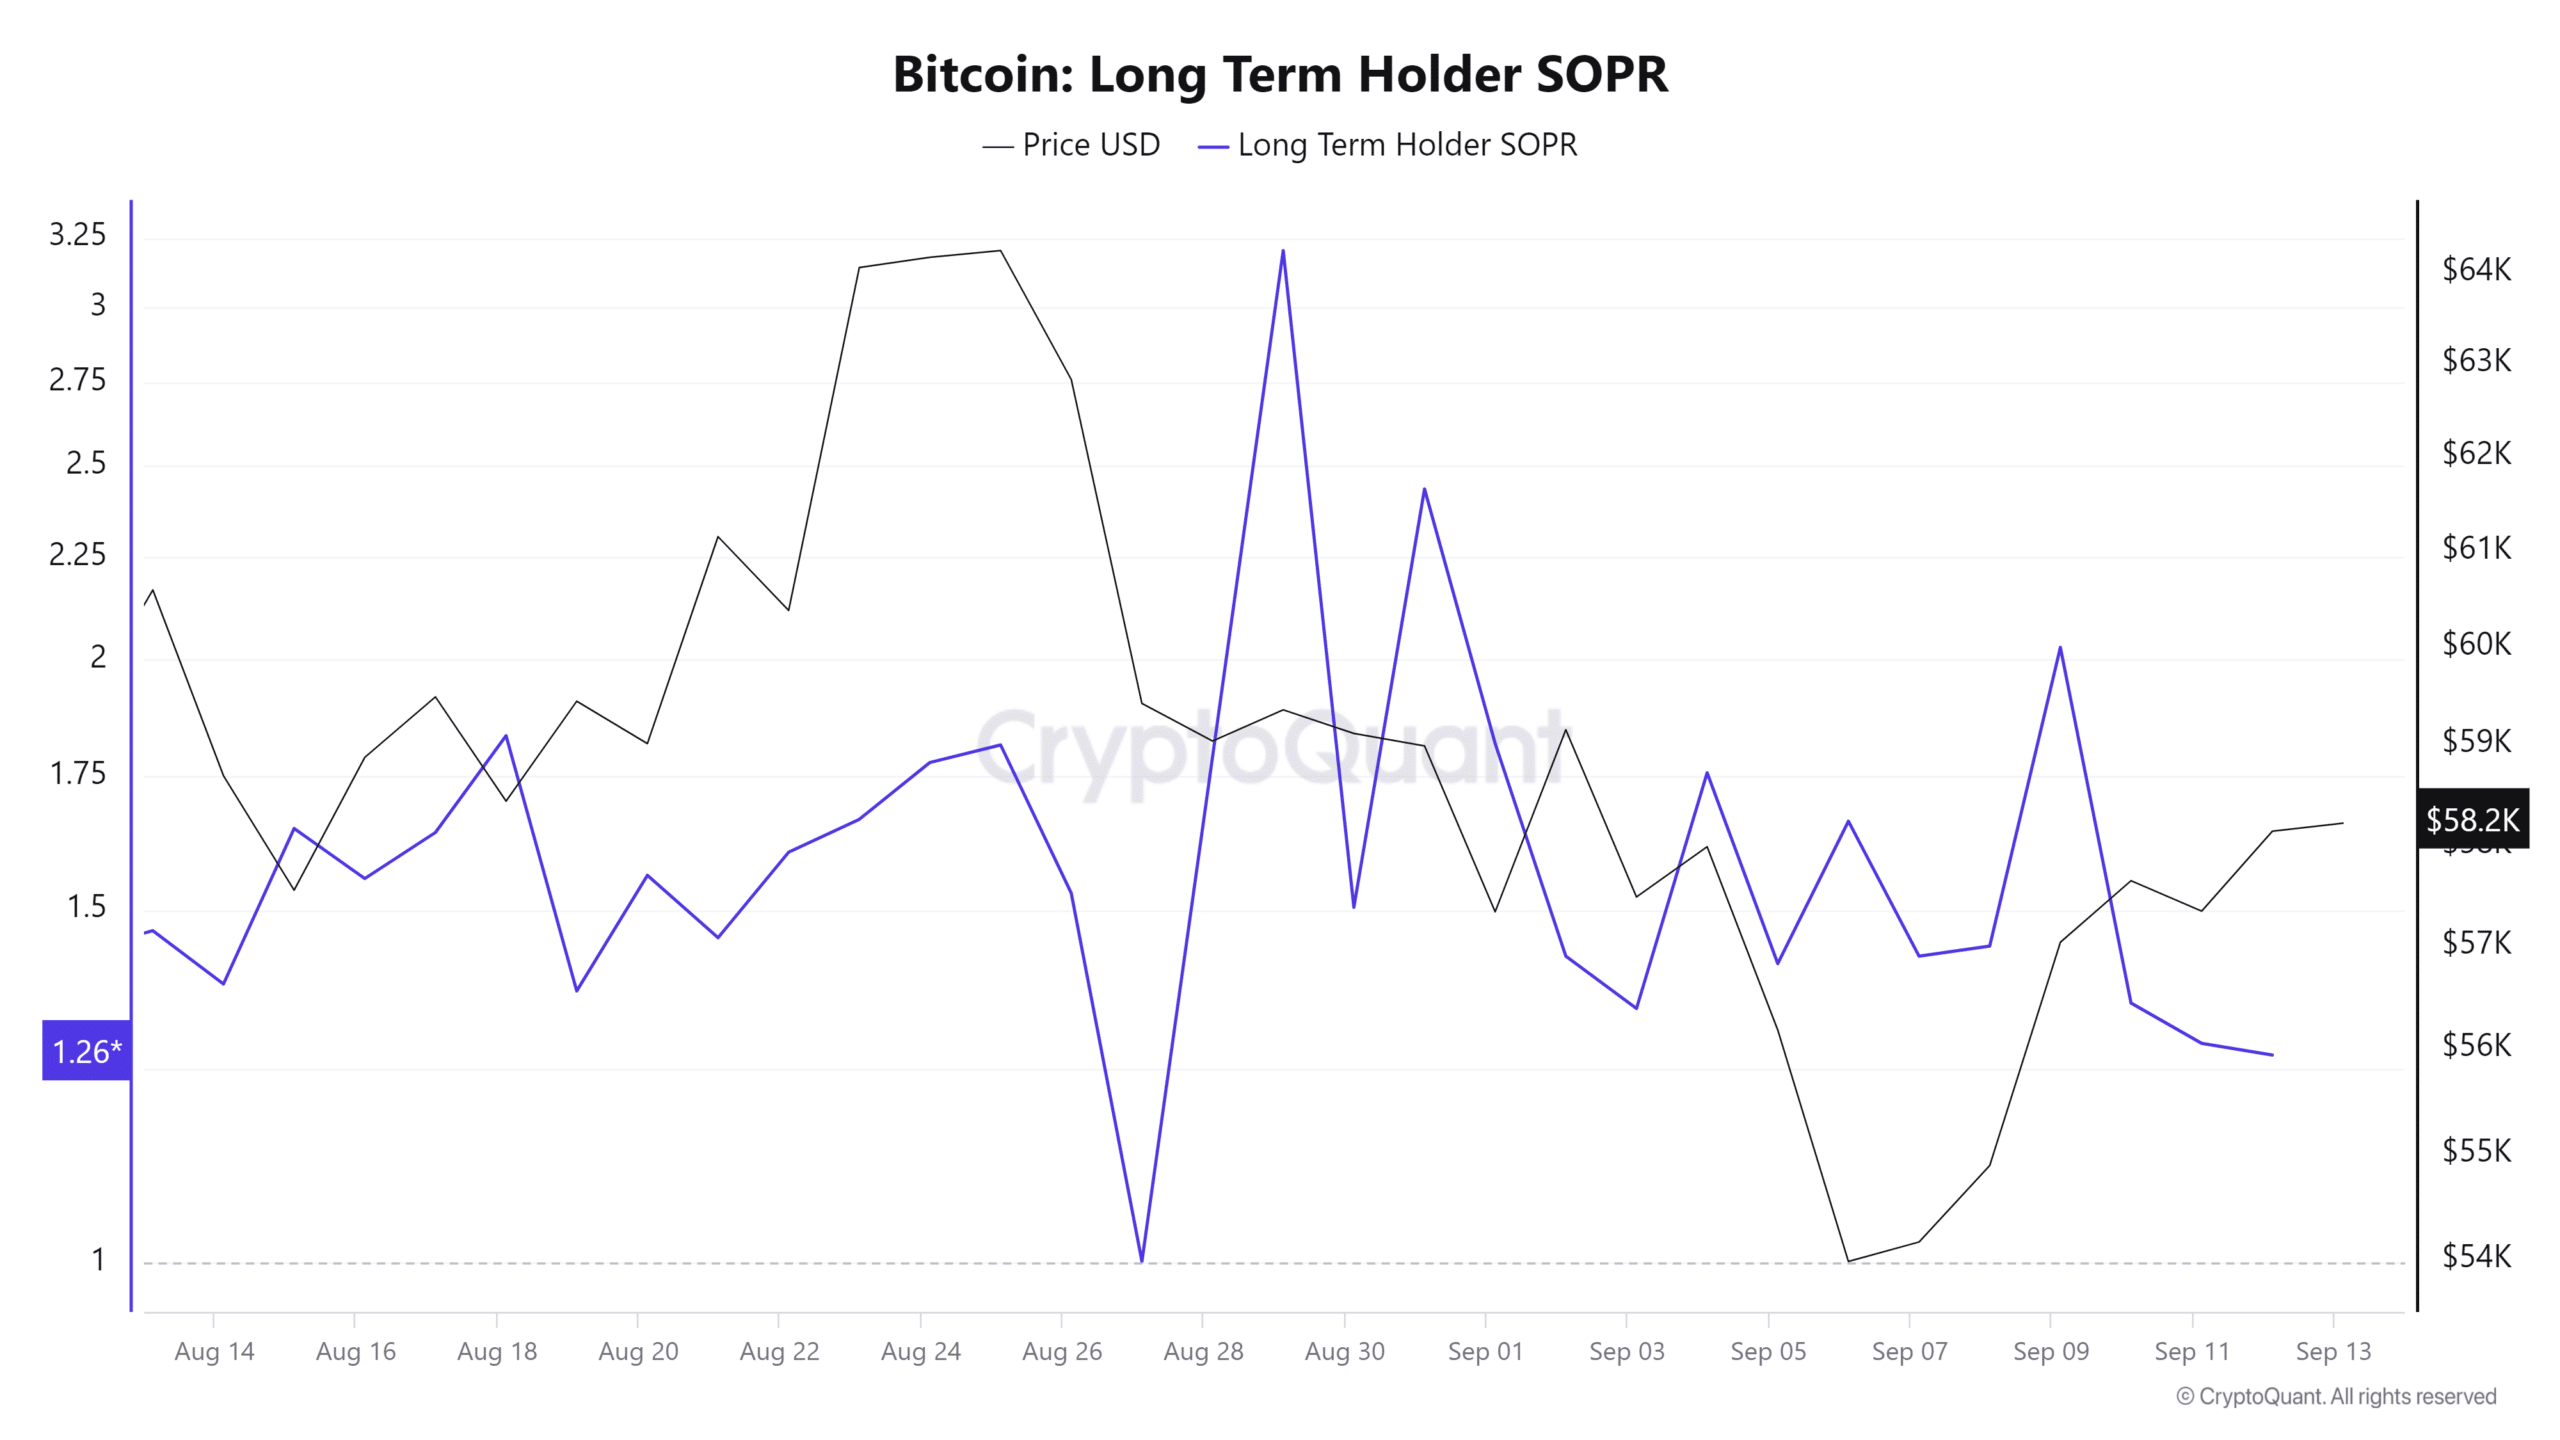
To begin with, Bitcoin’s long-term holder SOPR has been in a descending channel since August 29. The LTH SOPR has fallen from 3.2 to 1.2, indicating bearish sentiment among long-term investors.

This implied that they no longer expected BTC to recover, thus selling to avoid further losses.

Such market behavior leads to selling pressure, which drives prices down.

Source: CryptoQuant

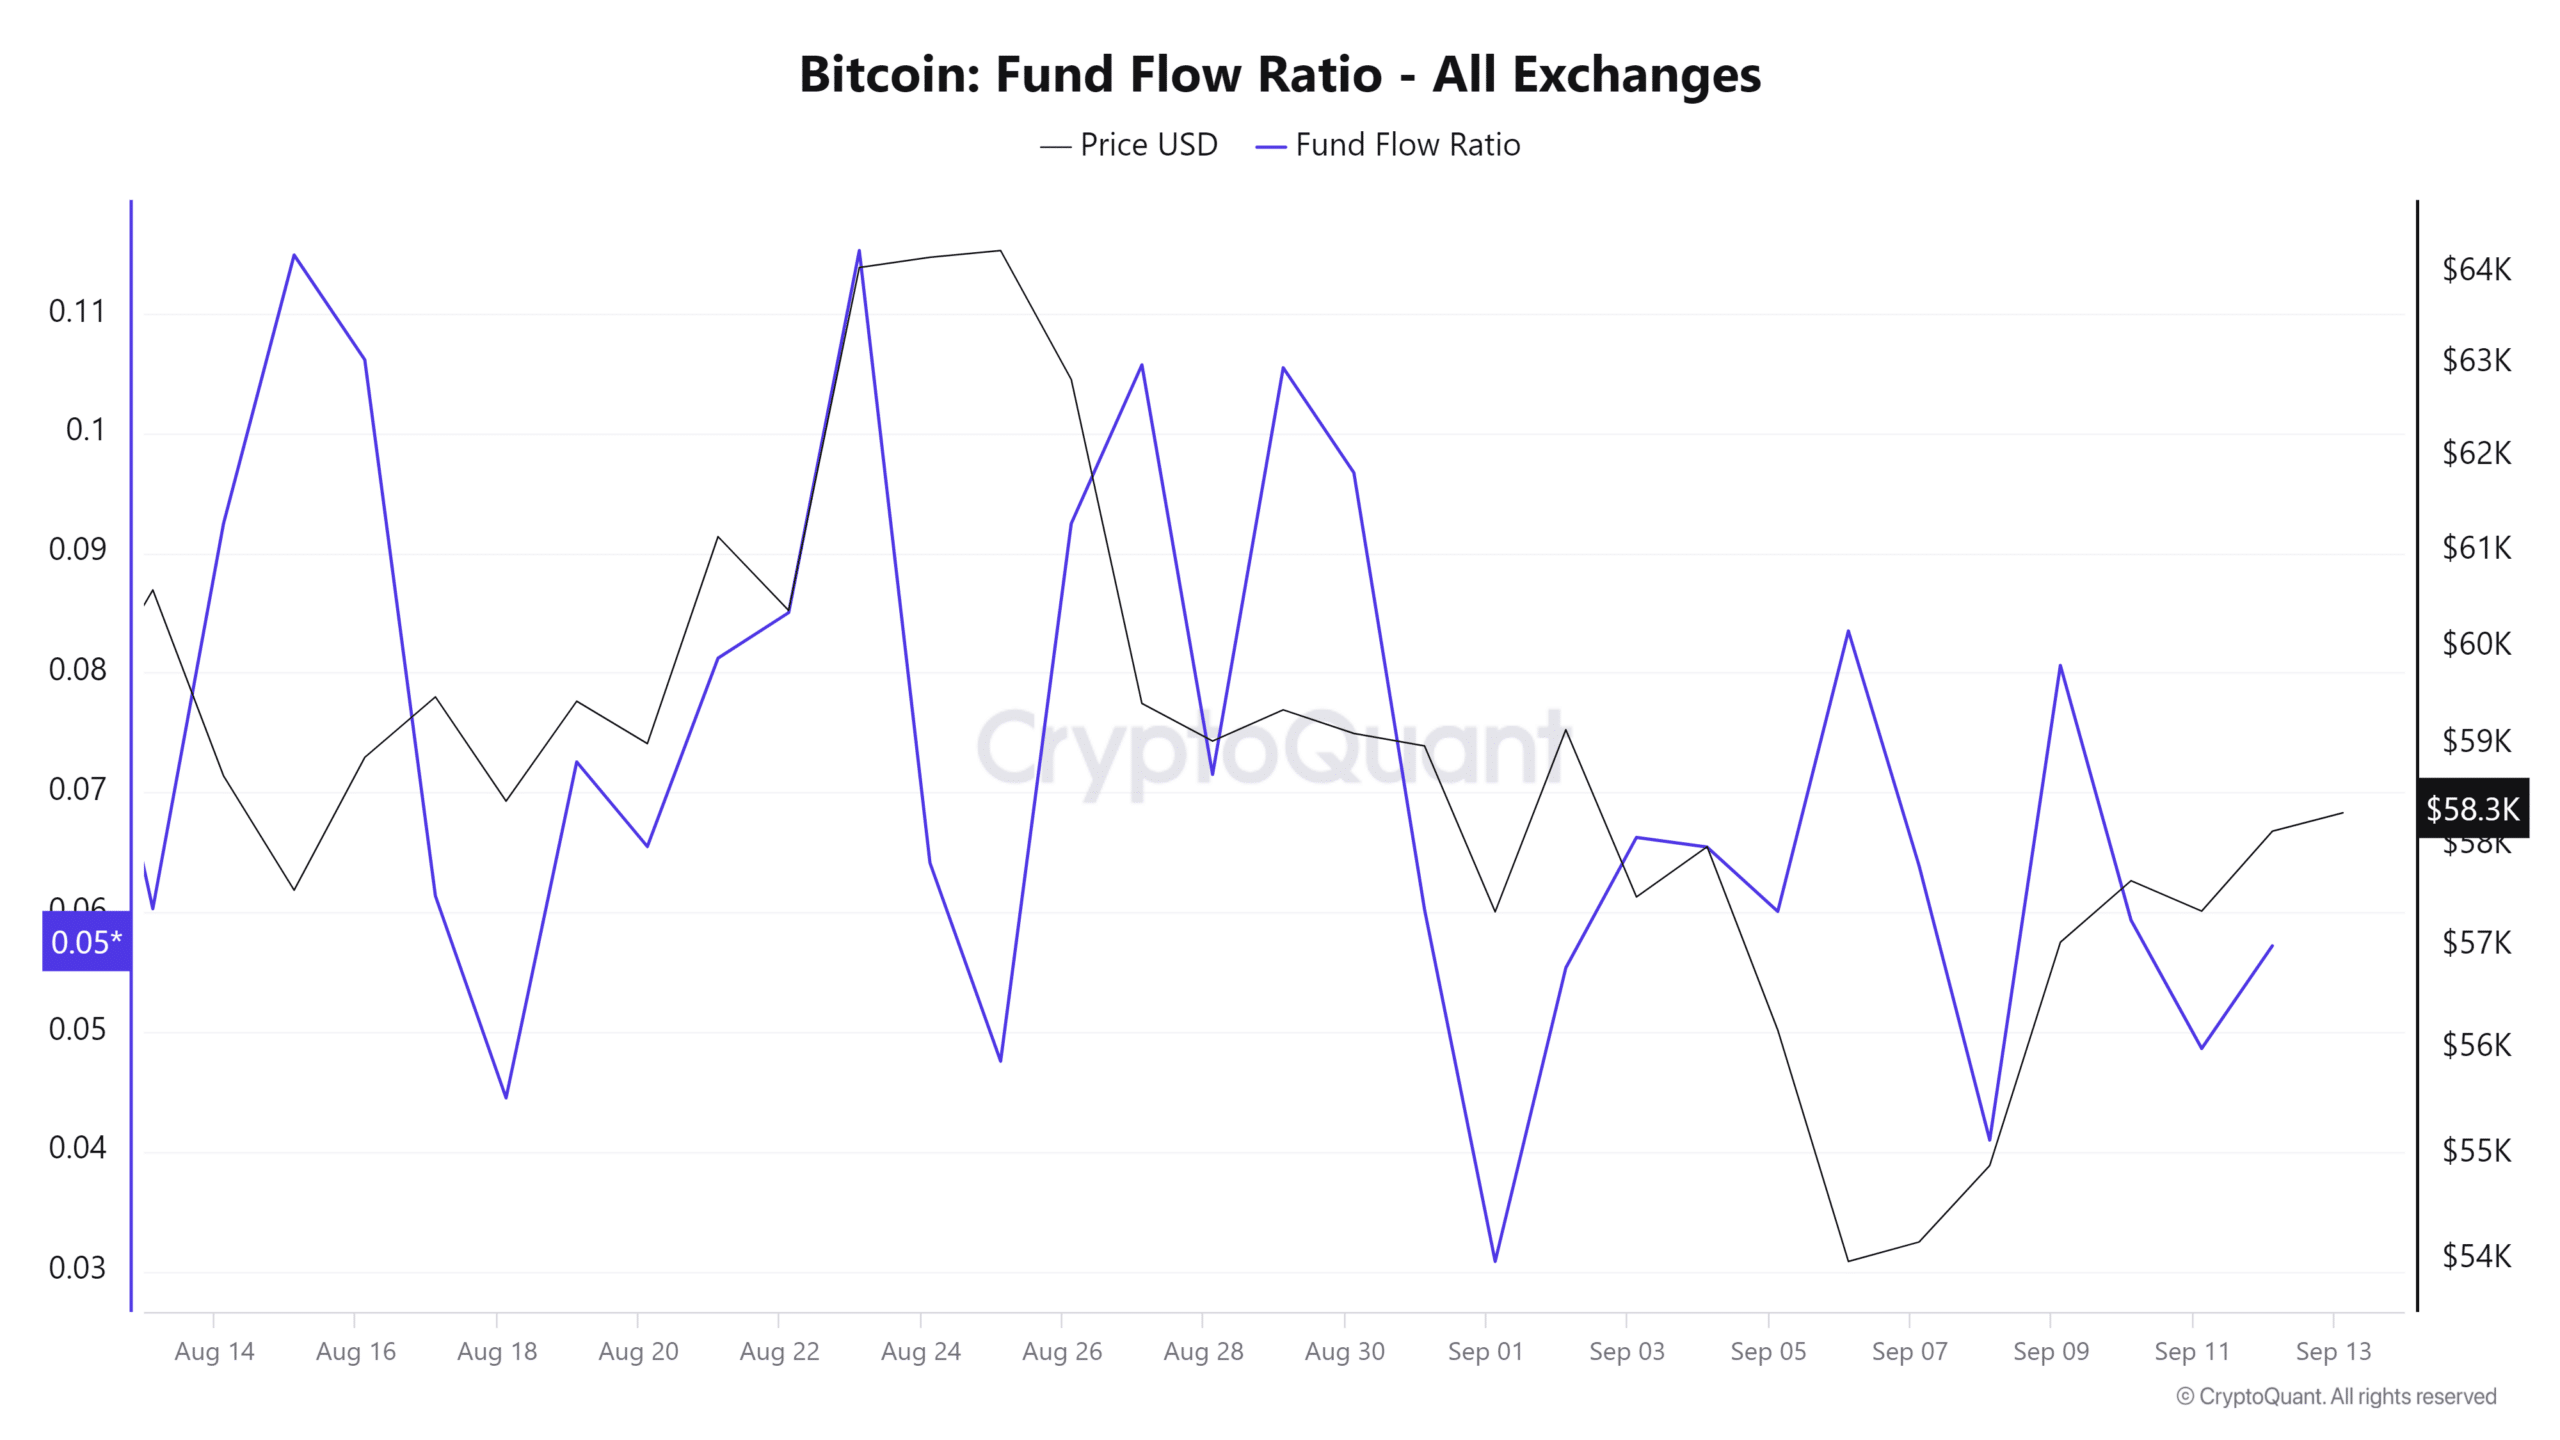
Additionally, Bitcoin’s fund flow ratio has declined over the past month, implying less capital inflow relative to overall transaction volume.

This suggests that investors are lacking confidence and are not investing new funds. When investors close their positions, this leads to selling pressure, which pushes prices further down.


Read Bitcoin (BTC) Price Predictions for 2024-2025


Therefore, as Martinez suggests, a drop below the 200-day moving average implied further decline. Based on current market sentiment, BTC was positioned to drop to $54,147 in the near term.

However, a break of this trendline would push prices up to $64,727.

Next: Arbitrum Dominates L2 TVL, But ARB Price Doesn’t React – Why?


Source link

Share. Facebook Twitter Pinterest LinkedIn Tumblr Email
Previous ArticleArbitrum Dominates L2 TVL, But ARB Price Doesn’t React – Why?
Next Article Time to Convert Bitcoin to Ethereum? ETH/BTC Charts Are Preparing for a 180% Surge

Related Posts

Bitcoin

The US-Uk Trade Agreement Pushes Bitcoin on 100k, ETH and Pepe Soar

May 9, 2025
Bitcoin

Why is Crypto up today? XRP price to reach $ 5 earlier than expected?

May 9, 2025
Bitcoin

ChainLink increases by 13% while exchange exits draw on

May 9, 2025
Add A Comment
Leave A Reply Cancel Reply

Single Page Post
Share
  • Facebook
  • Twitter
  • Instagram
  • YouTube
Featured Content
Videos

Tokenomics : The Mechanics and Magic of Decentralized Funding | Jason Fernandes | TEDxSDMIMD Mysuru

May 9, 2025

The Mechanics and Magic of Decentralized Funding explores the powerful intersection of blockchain technology, economic…

Event

Altcoin Observer – Official Media Partner for Dutch Blockchain Week 2025

May 9, 2025

30% off DBW Summit! Use code OBSERVER30 at dutchblockchainweek.com. Only for A.O and AdLunam Community …

1 2 3 … 44 Next
  • Facebook
  • Twitter
  • Instagram
  • YouTube

Trader says that the market has prepared a strong reversal after a bull movement – here is its target for Ethereum and Altcoins

May 9, 2025

The commissioner of the dry criticizes the Ripple agreement, warns of the weakening of the legal authority

May 9, 2025

DOGECOIN (DOGE) leads a money breaking, $ 0.3 is the next stop?

May 9, 2025
Facebook X (Twitter) Instagram LinkedIn
  • About us
  • Disclaimer
  • Terms of service
  • Privacy policy
  • Contact us
© 2025 Altcoin Observer. all rights reserved by Tech Team.

Type above and press Enter to search. Press Esc to cancel.

bitcoin
Bitcoin (BTC) $ 102,997.60
ethereum
Ethereum (ETH) $ 2,355.48
tether
Tether (USDT) $ 1.00
xrp
XRP (XRP) $ 2.36
bnb
BNB (BNB) $ 673.76
solana
Solana (SOL) $ 172.64
usd-coin
USDC (USDC) $ 1.00
dogecoin
Dogecoin (DOGE) $ 0.207059
cardano
Cardano (ADA) $ 0.78475
tron
TRON (TRX) $ 0.26305