- XRP surpasses the 1.618 Fibonacci level, analysts see a potential 6,800% rebound to $168 this cycle.
- Strong uptrend confirmed as XRP trades above the 20, 50, 100 and 200 day EMAs, showing bullish momentum.
XRP Price action is attracting attention as analysts reference historical Fibonacci extensions to predict potential long-term targets. After emerging from a six-year triangle consolidation, XRP was trading at $2.37 at press time with 24-hour volume of $20 billion.
Despite a 5.32% decline over the past day, technical indicators and historical fractals of the asset suggest the possibility of substantial gains in the ongoing market cycle.
Market data reveals a circulating supply of 57 billion XRP, giving it a market capitalization of $135.17 billion. Analysts say XRP’s breakout reflects its 2017 bull cycle, where the asset saw a more than 600-fold increase, reaching its all-time high of $3.40.
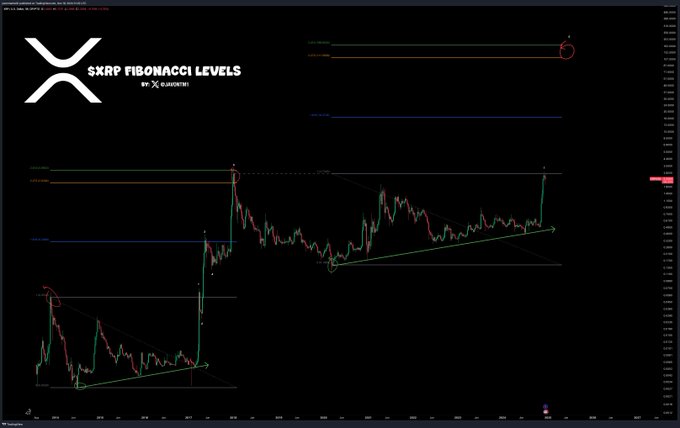
Current projections suggest that the cryptocurrency could rally to $168, aligning with the Fibonacci extension level of 2.414, if a similar performance occurs.
Fibonacci Levels Provide Key Targets for Price Projections
Historical price movements play a central role in the current analysis. During the 2017 rally, XRP respected Fibonacci levels, reaching the 2.414 extension before peaking.
Javon Marks, a crypto analyst, note that XRP’s past alignment at these levels adds credibility to the current projection of a potential 6,800% rebound.


Source:
In the current cycle, the 1.618 Fibonacci level has already been breached, with further price extensions targeting $4.50 and $13.00 as intermediate targets before hitting the $168 mark.
However, this optimistic scenario depends on sustained momentum and broader market support. The confirmation of XRP’s macro rise comes as global crypto adoption increases and pro-crypto policies gain traction.
Technical indicators suggest bullish momentum
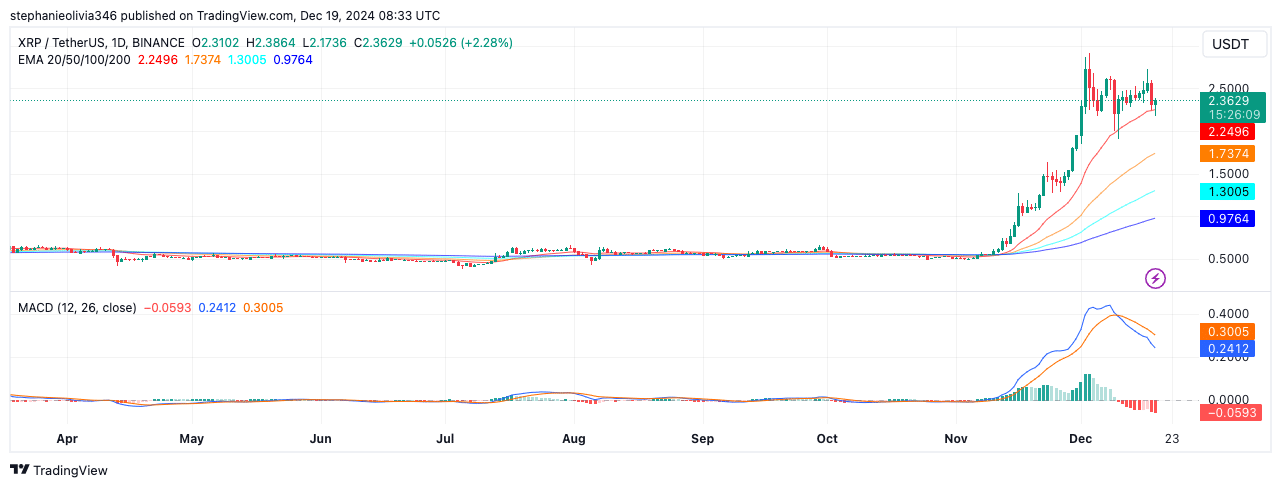
Recent technical patterns confirm the bullish momentum of XRP. The asset’s price remains above the 20, 50, 100, and 200-day EMAs, currently at $2.25, $1.73, $1.30, and $0.97, respectively. These levels indicate that XRP is firmly in an uptrend.


Source: TradingView
The MACD remains in bullish territory, with the MACD line (0.30) above the signal line (0.24). However, a slight drop in the histogram suggests reduced momentum in the near term.
A potential retracement towards the $2.25 EMA support could serve as a consolidation phase before further upward movement. Maintaining this support level could allow XRP to retest recent highs near $2.50.
Derivatives Data Indicates Increased Activity
XRP Derivatives Markets reflect increased interestwith a 10.34% increase in trading volume, reaching $24.49 billion. Although open positions decreased by 12.08%, likely due to profit-taking, options volume jumped by 17.41%, reflecting increased speculative activity.
Options open interest also increased by 16.20%, highlighting continued hedging interest.


Source: Coinglass
The long/short ratios on Binance and OKX indicate a bullish trend, with Binance’s top trader’s long/short ratio standing at 3.08.
Read XRP Price Forecast 2024-2025
However, liquidation data reveals $40.32 million in liquidations over 24 hours, mostly affecting long positions, suggesting short-term volatility despite the overall bullish sentiment.
This technical and market data highlights XRP’s growth potential as part of a broader cryptocurrency bull market.


