


Join our Telegram channel to stay up to date with the latest news
The price of
Prominent commodities trader Peter Brandt says the worst could be yet to come for the Ripple token, which he has chosen as one of the best candidates for shorting, provided it completes a continuous descending triangular pattern.
This is on my list of short candidates $XRP but this is conditional on the realization of the descending triangle pic.twitter.com/uai84VHLxa
– Peter Brandt (@PeterLBrandt) October 9, 2025
If this downtrend plays out, Brandt suggests that XRP could plunge nearly 21% to $2.22.
Meanwhile, JA Maartunn on
JUST IN: $XRP the whales are disembarking 🐋
Whale Flow (30DMA): -$50M/day.
Selling pressure persists. pic.twitter.com/Hcnys9vCCV
– Maartunn (@JA_Maartun) October 10, 2025
With the price of XRP up 433% over the past year, the are the bulls taking back control?
XRP Price Movements Indicate Clear Bearish Scenario
After a parabolic movement in July which pushed the XRP Price At a new ATH of $3.65, bears used this resistance to stage a price retracement within the confines of a descending triangle pattern, with bulls using support at $2.74 to attempt to contain bearish pressure.
However, as the Ripple token price approaches the peak, the momentum shows that the asset is preparing for a breakdown.
Due to the continued downtrend, XRP price has now moved below the 50-day simple moving average (SMA) at $2.92, confirming the current bearish sentiment. However, the 200-day SMA is holding firmly at $2.58, which could be the next key support zone if the Ripple token price continues to decline.
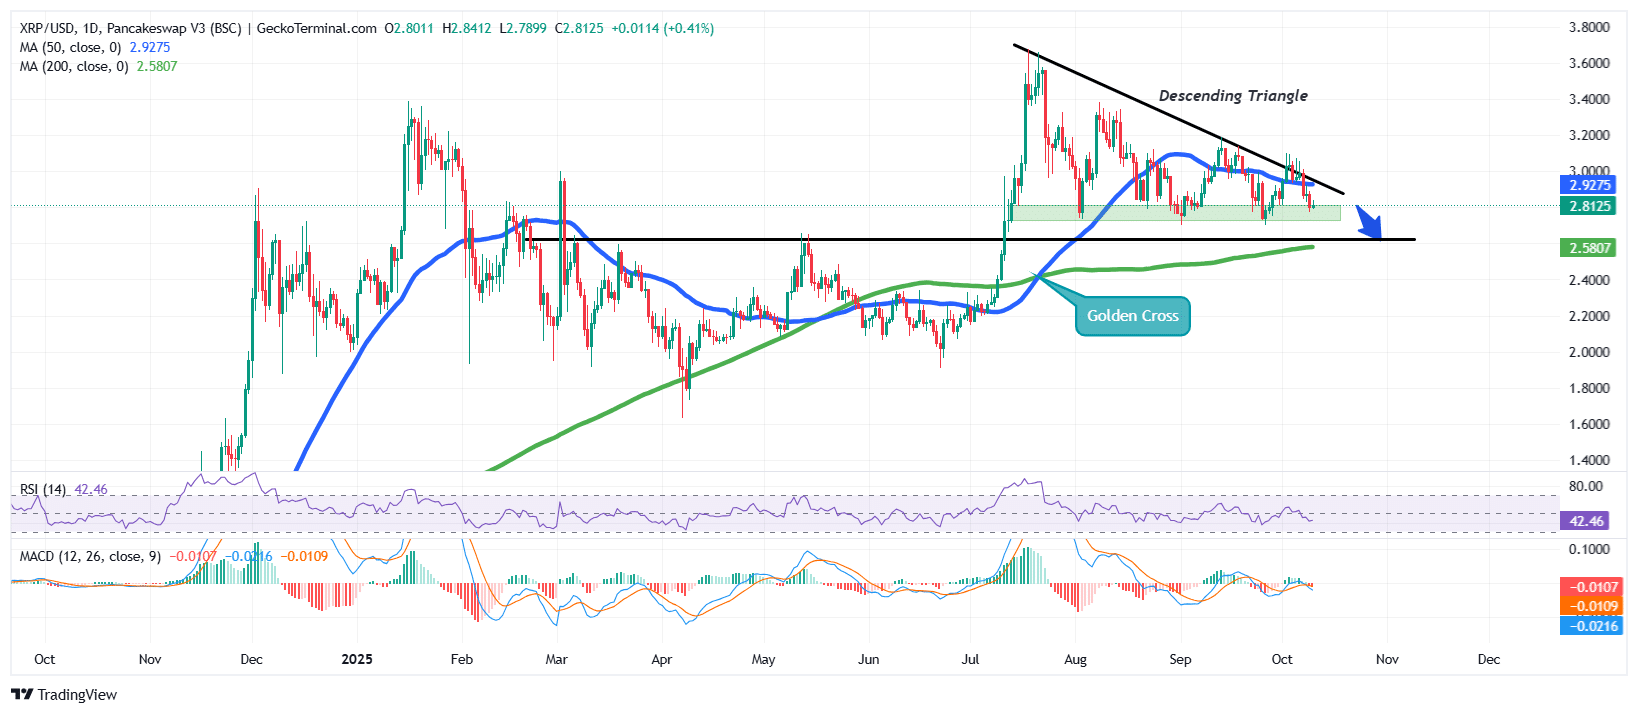
Meanwhile, the Relative Strength Index (RSI) also supports the bearish narrative, with the RSI falling towards the oversold region of 30, currently at 42.
The Moving Average Convergence Divergence (MACD) is also negative, with the orange signal line now moving above the blue MACD line. The red bars on the histogram have also started to form, which also shows that the momentum has turned negative.
Ripple token price targets support around $2.64
According to the XRP/USD chart analysis on the daily time frame, the price of the Ripple token is poised for a continuation of the downtrend, with the price now approaching the lower boundary of the descending triangle.
If the downtrend continues, XRP price may continue to fall, with the immediate support zone being $2.64, which was the previous resistance in March and May 2025.
Major technical indicators including the RSI and MACD support the bearish outlook as the bears appear to have complete control over the price.
Furthermore, according to Trading View According to the data, XRP dominance has seen a clear downward trend, recently reaching the lower range near 4.1%, signaling that XRP is losing market share to other cryptocurrencies.
This decline in dominance generally indicates relative weakness, suggesting that the price is likely underperforming the broader crypto market.
However, if the bulls take charge and the Ripple token price climbs towards the upper trendline at $2.92 (around the 50-day SMA), XRP could move even higher as the bulls could target the strong resistance at $3.14.
This outlook is supported by Ali Martinez, who now claims that XRP could find support at $2.73, allowing it to reach the $3.10 level.
$XRP could find support at $2.73. If this holds, a rebound to $3.10 is likely! pic.twitter.com/icugzPfPE4
– Ali (@ali_charts) October 9, 2025
Related news:
Best Wallet – Diversify your crypto portfolio

- Easy-to-use, feature-driven crypto wallet
- Get Early Access to Upcoming Token ICOs
- Multi-chain, multi-wallet, non-custodial
- Now on App Store, Google Play
- Stake to win a $BEST native token
- More than 250,000 active users per month
Join our Telegram channel to stay up to date with the latest news