- XRP has increased by 22.68% over the past seven days, while its trading volume has surged by 46.55%.
- Despite these recent gains, the overall market trend remains bearish.
Recently, Ripple (XRP) has seen a significant decline from a high of $0.6480 to $0.6500. After the market recovered from the crash and Ripple settled with the SEC, XRP prices surged.
However, the stock struggled to maintain its recent gains, continuing its previous bearish momentum.
Despite XRP’s failure to sustain its gains, analysts are betting on its prospects. As Ledger Man predicted a further push towards an all-time high, noting that,
“XRP could potentially go from $1 to $10 or more, driven by anticipation surrounding the XRP ETF, #Ripple stablecoin, and after the $125 million fine is paid.”
However, as things stand, AMBCrypto’s analysis showed that the altcoin was in a strong downtrend, with recent losses outpacing recent gains.
What the XRP Price Charts Indicate
At the time of writing, XRP was trading at $0.5744 after surging 22.68% over the past seven days. Similarly, the altcoin has surged 12.60% over the past month.
XRP’s trading volume over the past 24 hours also increased by 46.55% to $1.4 billion.


Source: TradingView
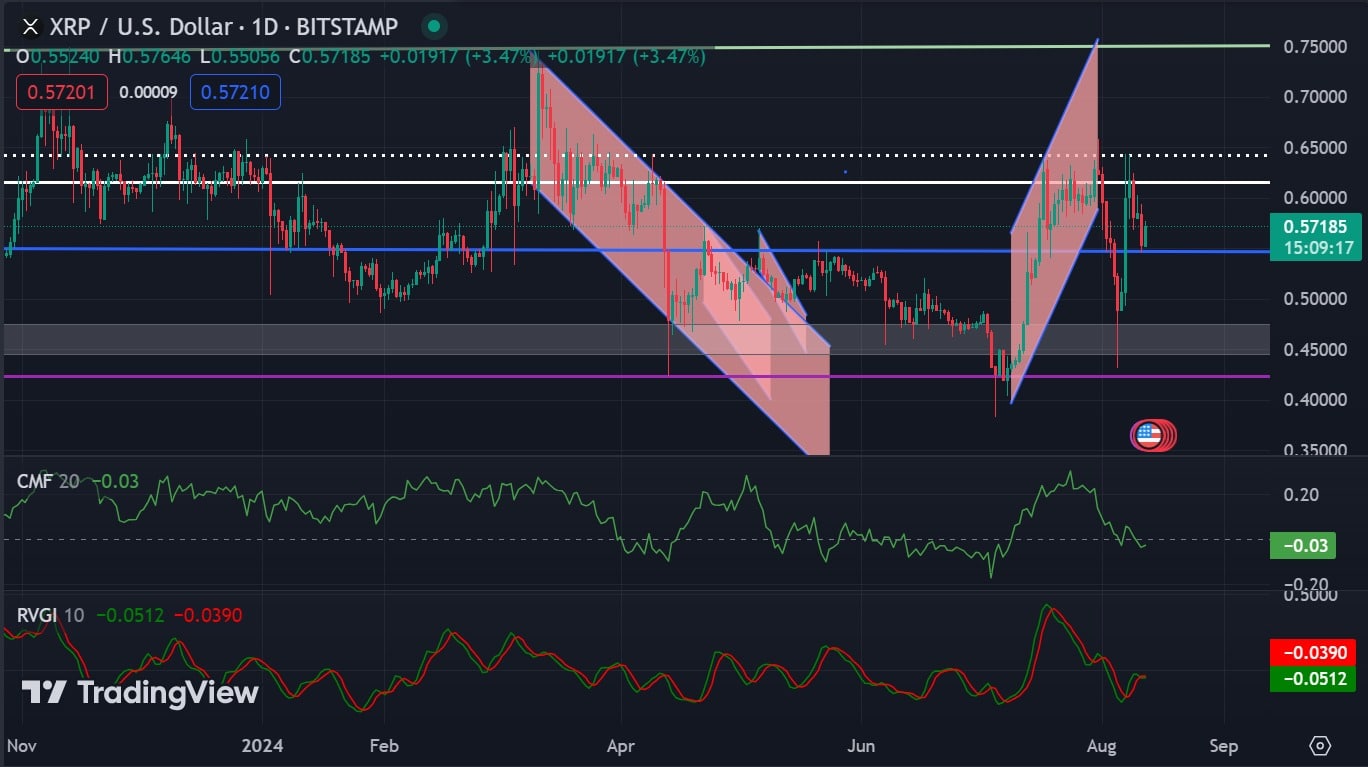
However, despite these gains, the overall market sentiment was bearish. Looking at the CMF, it was -0.03 at press time. This suggests that there is more selling pressure than buying, creating a bearish sentiment with sellers dominating.
Additionally, the RVGI was below zero, indicating that closing prices are lower than opening prices. This further proves that selling pressure is dominant and the market is in a strong downtrend.


Source: TradingView
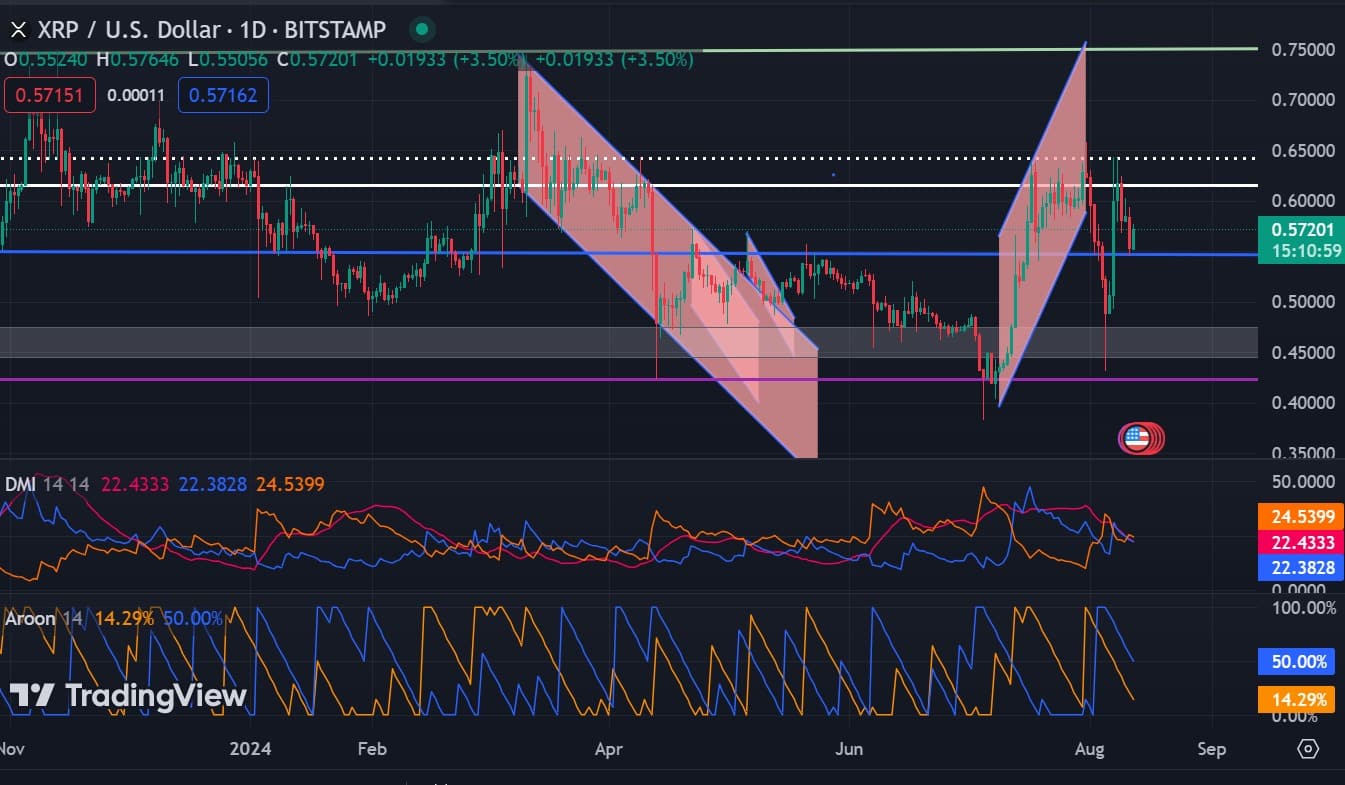
XRP’s DMI and Aroon lines proved once again that the downward momentum was strong. The positive DMI index at 22.38 was lower than the negative index at 22.43.
Additionally, the Aroon Down was at 50%, above the Aroon Up at 14.29%. This showed that XRP was experiencing sustained downtrend momentum.


Source: Coinglass
Looking closer, AMBCrypto’s analysis on Coinglass showed that XRP’s open interest had dropped from $691 million to $578 million. This suggests that investors were closing positions without opening new ones.


Source: Coinglass
Finally, XRP’s netflow has been negative over the past month. This showed that investors were lacking confidence in the altcoin, thus selling their positions as they moved assets to exchanges for sale.
XRP Retests Key Support Level
In less than two weeks, XRP has fallen from a high of $0.653. The altcoin has failed to maintain its momentum above $0.6 despite recent gains. At press time, XRP was facing resistance around $0.61.
Realistic or not, here is the market capitalization of XRP in terms of BTC
If the daily candlestick closes above the support level of $0.580, it may bounce towards the next resistance level around $0.6.
However, if it fails to hold above $0.58, it will decline to critical support around $0.55 with a break below this level further pushing the altcoin to $0.52.


