


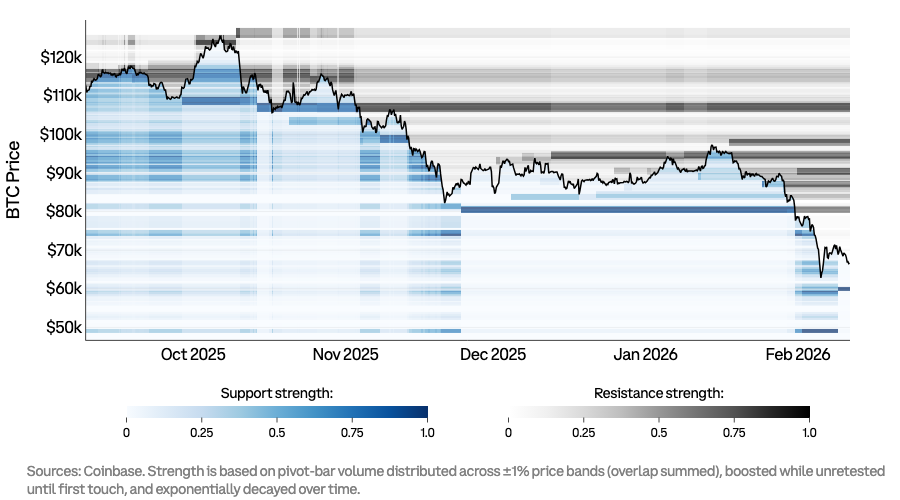
Coinbase says Bitcoin’s near-term trajectory could depend on two price zones: around $82,000 on the upside and $60,000 on the downside. In a new article
The basic framework begins with Coinbase’s previously shared heat map of “real supply and demand levels,” built by aggregating pivot points of market structure and volume into price ranges. In this setup, the densest support cluster lies near $60,000, while the first dense resistance band lies at around $82,000. Coinbase describes these areas as areas where market interest has already been established and where “large pools of resting liquidity typically congregate.”
Why Bitcoin Gamma Changes Reading
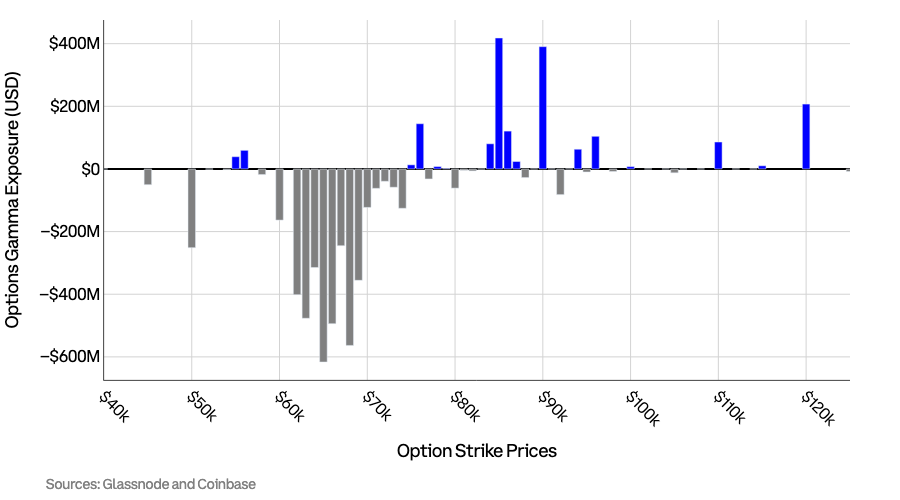
This week’s addition is Gamma Exposure (GEX), which Coinbase touts as a way to map how options brokers’ hedging flows can either absorb volatility or amplify it. The company calls the options market a “hidden liquidity provider” and says GEX helps investors decide whether conditions favor range or breakout trades.
Related reading
Coinbase explains the mechanism in practical terms: when traders are long, their hedging tends to lean against price movements; when they are short on gamma, coverage can reinforce the move. “In positive gamma regions, the dominant hedging behavior often resembles a shock absorber, because if BTC rises, traders sell spot (or sell futures) to remain hedged. If BTC falls, they buy to rebalance. This “sell strength/buy weakness” pattern reduces realized volatility and increases the chances of consolidation and “lock-in” around nearby strike groups.”
He then compares this to the negative gamma regime. “In regions with negative gamma, dominant hedging behavior can turn into a trend amplifier. Rising BTC prices force hedgers to buy more, while falling prices force hedgers to sell more. This ‘buy strength/sell weakness’ loop can turn ordinary breakouts into rapid cascades of revaluation and liquidation.”
After overlaying GEX on its pivot chart, Coinbase’s conclusion is simple but consequential. “$82,000 remains the first door to unlocking further upside, while $60,000 appears to be the level that needs to be maintained to avoid an accelerated decline,” the post said. This is linked to a “pronounced negative gamma band” in the $60,000-$70,000 region and “significant positive gamma pockets” around $85,000 and $90,000.
Related reading
This combination shapes regime expectations. Coinbase says the decline to $60,000 may accelerate as negative gamma may amplify selling pressure, while a rise toward $90,000 may be more likely to be crushed and stalled as positive gamma hedging dampens momentum.
How Coinbase regulates setups
The playbook’s scenario analysis reflects this asymmetry. Around $82,000, Coinbase views first touch rejection as a credible risk in a dense supply zone, especially without a clear macro catalyst. If BTC fails at this level, it indicates that mean reversion becomes the more likely expression and warns that breakout chasers can get trapped.
In contrast, a sharp breakout above $82,000 is defined not by a brief spike but by “acceptance” – reclaiming the level, holding it and using it as support. Coinbase argues that this would suggest supply has been absorbed and increase the chances of continuation into higher liquidity bands, while recognizing that the positive gamma pocket above could increase outage risk.
The $60,000 area is framed with even more care. Coinbase says it prefers to go long only after a recovery signal if BTC flows into that area, rather than trying to catch up to the initial move lower, as negative gamma can make the path “violent and prone to overshoot.” If $60,000 fails and BTC can’t recover it, Coinbase says the breakout could mark another “regime shift” where the decline extends faster than discretionary buyers expect.
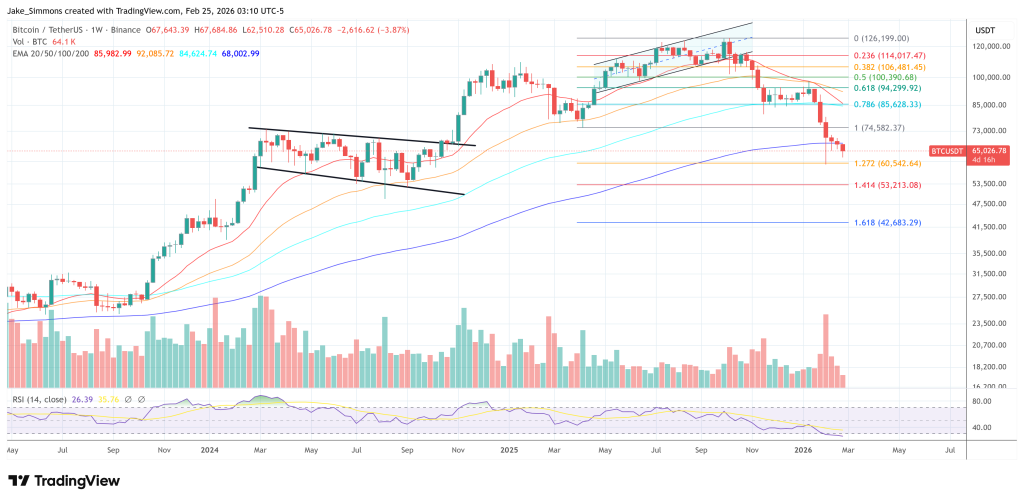
At press time, Bitcoin was trading at $65,026.
Featured image created with DALL.E, chart from TradingView.com