



Close Menu
Altcoin ObserverAltcoin Observer
  • Regulation
  • Bitcoin
  • Altcoins
  • Market
  • Analysis
  • DeFi
  • Security
  • Ethereum
Categories
  • Altcoins (3,732)
  • Analysis (3,840)
  • Bitcoin (4,470)
  • Blockchain (2,157)
  • DeFi (2,623)
  • Ethereum (2,773)
  • Event (119)
  • Exclusive Deep Dive (1)
  • Landscape Ads (2)
  • Market (2,714)
  • Press Releases (12)
  • Reddit (2,847)
  • Regulation (2,474)
  • Security (4,103)
  • Thought Leadership (3)
  • Videos (44)
Hand picked
  • Uniswap RFC explores running private exchanges using v4 and UniswapX hooks
  • Australia targets Telegram a day after Russia indicts Durov
  • Bitcoin’s weak hands fold
  • Success Story: Jonathan Nichols’ Learning Journey with 101 Blockchains
  • Kraken Cyprus honored at the 14th Invest Cyprus International Investment Awards
We are social
  • Facebook
  • Twitter
  • Instagram
  • YouTube
Facebook X (Twitter) Instagram
  • About us
  • Disclaimer
  • Terms of service
  • Privacy policy
  • Contact us
Facebook X (Twitter) Instagram YouTube LinkedIn
Altcoin ObserverAltcoin Observer
  • Regulation
  • Bitcoin
  • Altcoins
  • Market
  • Analysis
  • DeFi
  • Security
  • Ethereum
Events
Altcoin ObserverAltcoin Observer
Home»Analysis»2-Year Ethereum Trend Charts This Unique Crash Path Down to $2,187
Analysis

2-Year Ethereum Trend Charts This Unique Crash Path Down to $2,187

December 16, 2025No Comments
Share Facebook Twitter Pinterest LinkedIn Tumblr Reddit Telegram Email
Share
Facebook Twitter LinkedIn Pinterest Email


Ethereum Price Action weakened again in the last 24 hours, the cryptocurrency fell below $3,000 and lost around 6.8% in the last 24 hours alone.

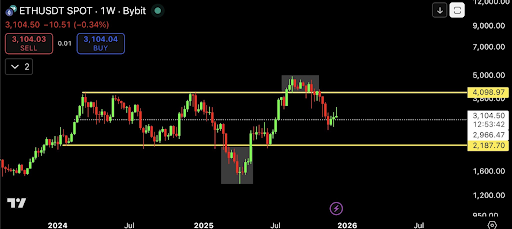
Immediate Price Action highlights recovery of this $3,000 supportbut a longer-term technical view suggests that the current decline could be part of a much larger and better-defined price framework. A macro analysis shared by crypto analyst Dona examines Ethereum’s behavior over the past two years with a structured range that suggests the cryptocurrency could reach $2,187.

Ethereum’s two-year range still defines the big picture

According to to analysisEthereum has largely been trading in a wide horizontal range for almost two years, with the exception of two notable counterfeits: one below resistance in the first half of 2025 and one above resistance in the second half, which led to a new all-time high price of $4,946 in August. On the weekly timeframe, price repeatedly respected an upper boundary between $4,000 and $4,100, while finding steady demand near lower support just above $2,100.

Related reading

This price action has resulted in a structure that resembles an inverted head and shoulders pattern on a macro scale. However, instead of signaling an immediate rise, the formation shows how price has oscillated between these defined trendlines, with mid-trend reactions often determining whether Ethereum pushes higher. resistance or falls back towards support.
Ethereum
Source: Dona’s chart on X

At the time of writing, Ethereum is trading in the mid-range of the two-year range. In this context, the recent bearish move can be seen less as a breakout and more as a rotation towards the lower trendline within the same long-standing range.

Why $2,187 is a critical downside target

The chart accompanying the analysis places particular emphasis on the lower limit of the range, near $2,187. This level has repeatedly served as a rebound during previous downtrends in 2024 and another in July 2025.

Related reading

If Ethereum continues to trade below intermediate support currently around $3,000, then price could follow a familiar range rotation path towards this lower boundary. This move will see Ethereum fall to $2,187.

At the time of writing, Ethereum is trading at $2,928 and is still down 25% from $2,187. While this would be tragic for bullish traders, such a move would not necessarily invalidate the broader structure. Instead, it will complete another cycle in the range, similar to previous declines that eventually turned into a rebound for a rally phase.

One of the most remarkable aspects of Dona’s outlook is the expectation of a moderate activity in the short term. Aside from range-bound trades, taking directional positions may prove less attractive as liquidity diminishes toward the end of the year. From this point of view, the next major step will probably come in January 2026.

Ethereum
ETH trades at $2,929 on 1D chart | Source: ETHUSDT on Tradingview.com

Featured image from Freepik, graphic from Tradingview.com


Source link

Share. Facebook Twitter Pinterest LinkedIn Tumblr Email
Previous ArticleWhat a $100 investment in this new crypto could look like by the end of Q1 2026, top investors take their seats early
Next Article KULA is available for exchange!

Related Posts

Analysis

Bitcoin’s weak hands fold

July 30, 2026
Analysis

CLARITY Act Delay Shows Fight Against Crypto Market Structure Is Not Over

July 30, 2026
Analysis

CLARITY Act delay risks taking US lead on crypto, lawmaker warns

July 28, 2026
Add A Comment
Leave A Reply Cancel Reply

Single Page Post
Share
  • Facebook
  • Twitter
  • Instagram
  • YouTube
Featured Content
Event

Dutch Blockchain Week 2026 strengthens position as Europe’s leading B2B blockchain event week

April 14, 2026

Amsterdam, April 2026 – Dutch Blockchain Week 2026 is rapidly evolving into one of Europe’s…

Event

Global Games Show Riyadh: The Ultimate Creator & Influencer Hub

March 31, 2026

The fast-evolving gaming ecosystem of Riyadh is powered by solid national investment, a flourishing esports…

1 2 3 … 82 Next
  • Facebook
  • Twitter
  • Instagram
  • YouTube

Australia targets Telegram a day after Russia indicts Durov

July 30, 2026

Ethena whales withdraw 102 million tokens from exchanges: has ENA selling pressure eased?

July 30, 2026

Audiera loses KEY support – can BEAT recover from 24% crash?

July 29, 2026
Facebook X (Twitter) Instagram LinkedIn
  • About us
  • Disclaimer
  • Terms of service
  • Privacy policy
  • Contact us
© 2026 Altcoin Observer. all rights reserved by Tech Team.

Type above and press Enter to search. Press Esc to cancel.

bitcoin
Bitcoin (BTC) $ 75,104.00
ethereum
Ethereum (ETH) $ 2,125.93
tether
Tether (USDT) $ 0.999049
bnb
BNB (BNB) $ 689.56
usd-coin
USDC (USDC) $ 0.999495
xrp
XRP (XRP) $ 1.10
solana
Solana (SOL) $ 86.41
tron
TRON (TRX) $ 0.317338
staked-ether
Lido Staked Ether (STETH) $ 2,265.05
figure-heloc
Figure Heloc (FIGR_HELOC) $ 1.04