



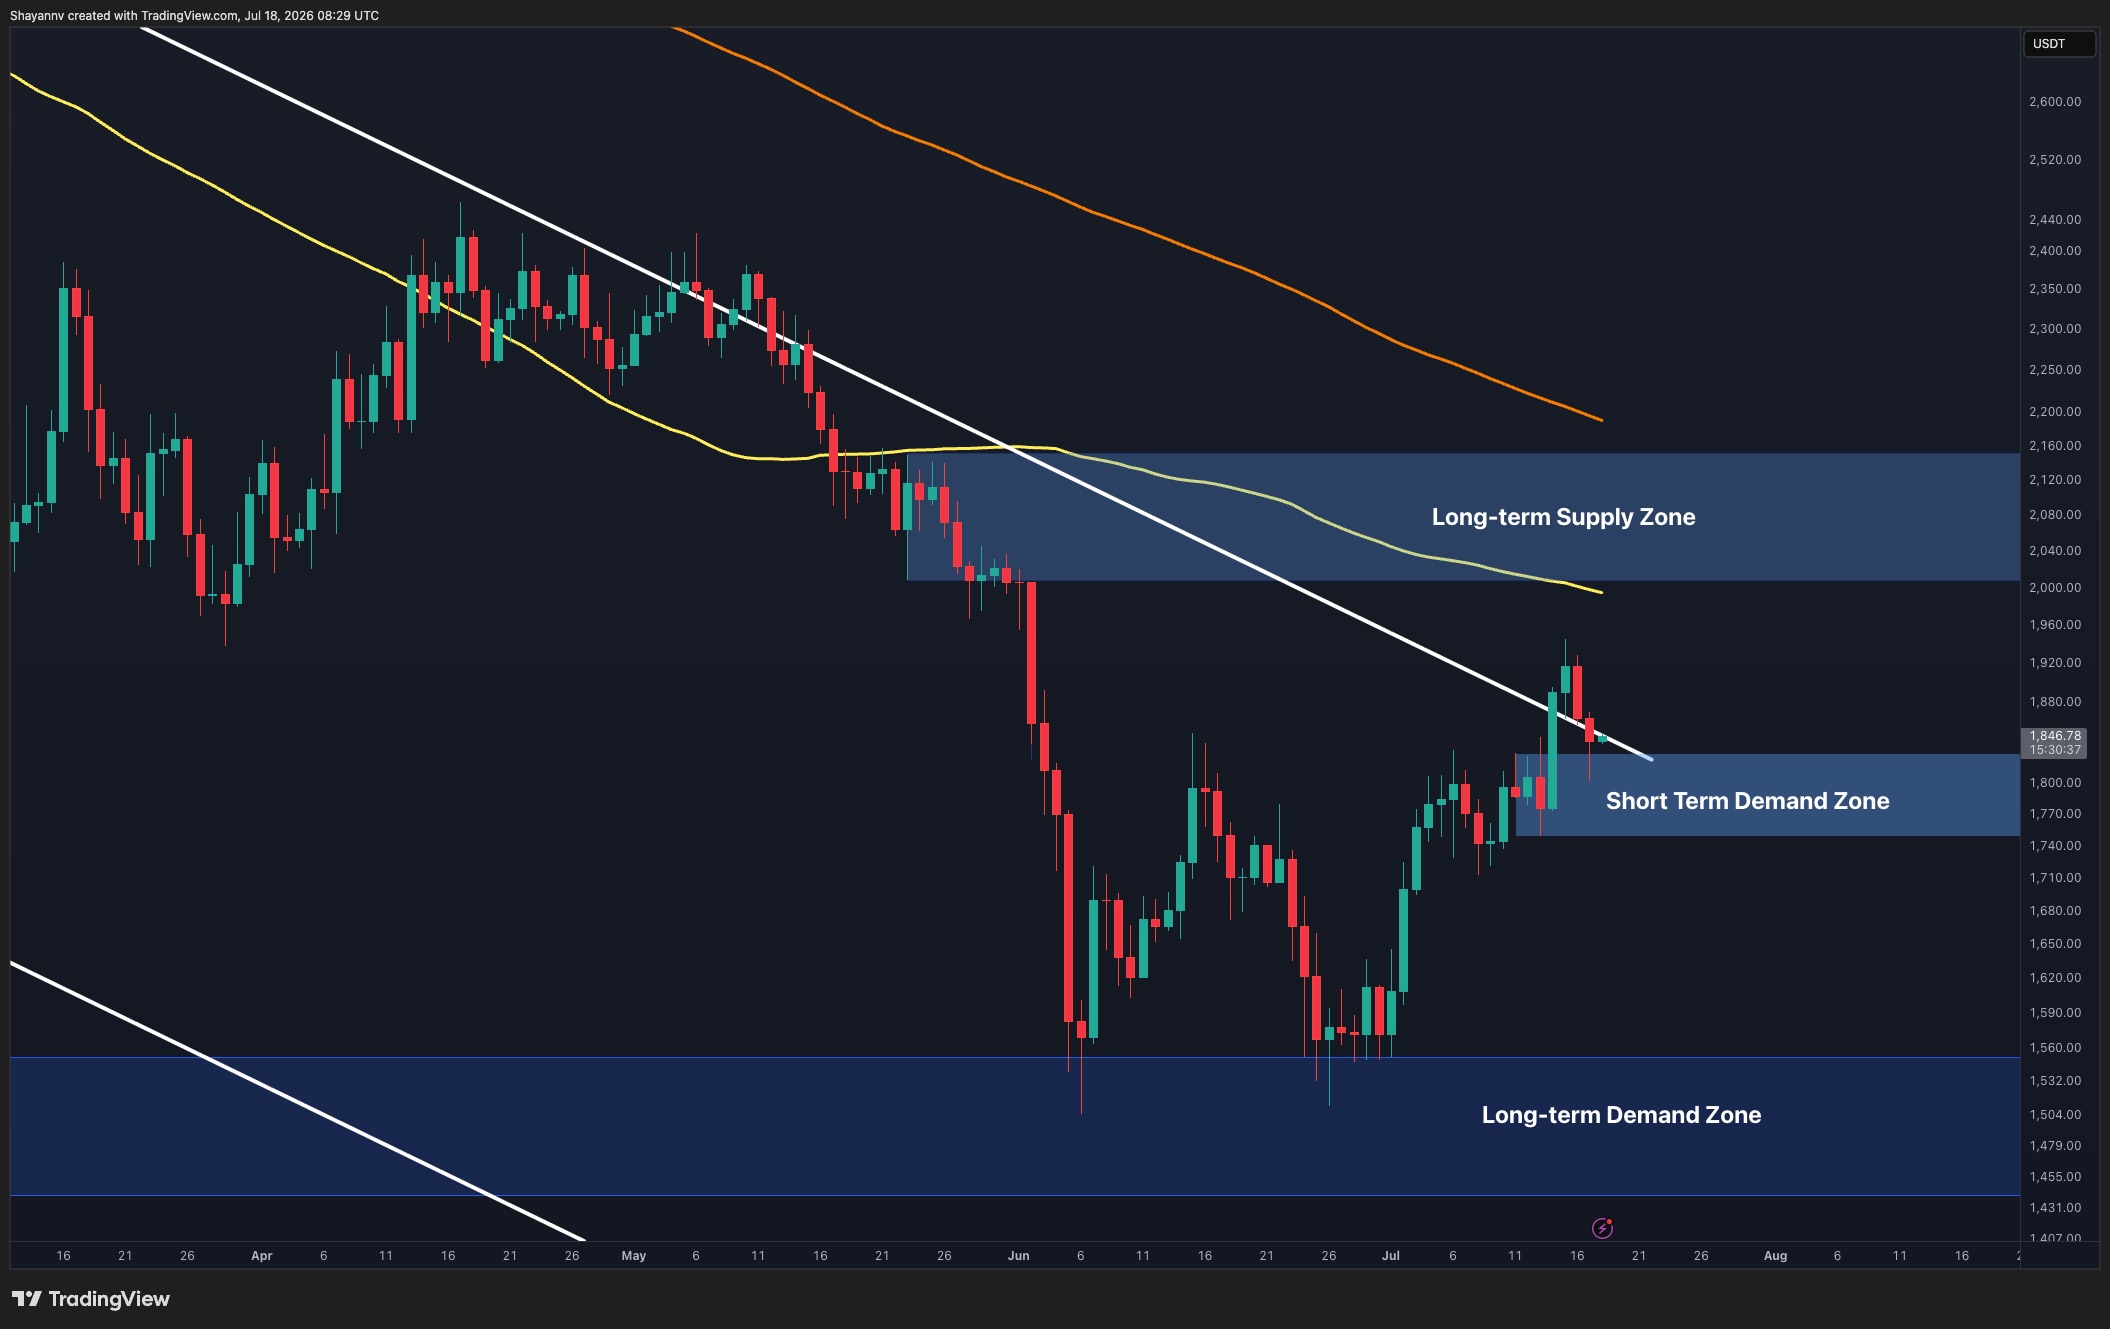
Ethereum remains trapped below an important longer-term resistance cluster despite a strong recovery from its June lows. The recent rejection near local highs has pushed the asset back into an important support zone, while price approaches a technical decision point that should determine whether buyers can extend the rally towards higher resistance or another corrective leg unfolds.
ETH Price Analysis: The Daily Chart
On the daily timeframe, ETH continues to trade below the descending 100- and 200-day moving averages, confirming that the broader market structure remains bearish despite the recent rebound.
The asset recently failed to sustain a move above the short-term resistance around $1.9k and has now returned to the $1.75k-$1.85k demand zone. This region has served as support throughout the current recovery and now represents the first line of defense for buyers.
As long as Ethereum holds above this zone, another push towards the major decision zone between $2,000 and $2.15,000 remains possible. This region also aligns with the long-term descending trendline and the falling 100-day moving average, making it the most important resistance group on the daily chart.
A successful breakout above this confluence would mark a significant structural improvement, while a rejection would likely shift attention back to the long-term demand zone around $1.45,000 to $1,550,000.
ETH/USDT 4-hour chart
The 4-hour chart shows Ethereum retreating after failing to surpass the recent high near $1.95,000. The correction pushed it back into the near-term demand zone around $1.76,000 to $1,840,000, which has repeatedly attracted buyers over the past week.
This area now serves as the immediate support needed to preserve the sequence of lower to higher levels established since early July. Holding above could allow another attempt towards the upper boundary of the current recovery structure and possibly daily resistance around $2,000.
However, loss of this demand zone would likely expose lower support levels around $1.7k before buyers attempt another rally.
Sentiment analysis
The liquidation heatmap highlights a large concentration of short liquidations positioned above the current market, with the most notable liquidity cluster around the $1.95k-$2k region.
Importantly, this liquidity pool closely aligns with key technical resistance visible on the daily and 4-hour charts. The cluster sits directly below the longer-term supply zone, around $2,000 to $2,150,000 and near the descending trendline, creating a strong confluence between derivatives positioning and technical resistance.
This alignment increases the likelihood that Ethereum could first make an upside liquidity grab into the $1.95K-$2K zone to sweep out leveraged short positions before facing further selling pressure from the overhead supply zone. A decisive breakout of both the liquidity cluster and daily resistance would invalidate this scenario and instead strengthen the case for a broader bullish reversal.
LIMITED OFFER for CryptoPotato readers at Bybit: Use this link to sign up and open a FREE $500 position on any coin!
Disclaimer: Information found on CryptoPotato is that of the cited authors. It does not represent the opinions of CryptoPotato on whether to buy, sell or hold any investments. You are advised to carry out your own research before making any investment decision. Use the information provided at your own risk. See Disclaimer for more information.


