


In an October 10 market update, technical analyst Nik Patel (@OstiumLabs) argued that Ethereum is approaching a decisive zone where the next few sessions could define whether the advance resumes or a deeper unfolding takes place. With spot ETH listed around $4,000, Patel anchored his thesis on a select group of recovery and invalidation levels on ETH/USD and ETH/BTC, emphasizing that short-term behavior must align with a longer-term structure to keep the bullish path open.
Key Price Levels for Ethereum Now
On the ETH/USD weekly chart, Patel said the market “dropped to the August open last week, but held above the previous weekly low and trendline support,” resulting in an inside week that nonetheless closed “slightly below this major pivot.” The pivot is explicit: “We want to see this pivot at $4,093 reclaimed immediately and not turned into resistance here on the lower timeframes, otherwise we could expect another wave of lowers towards the 2025 open.”
Related reading
If buyers force the recovery, Patel expects last week’s action to be a quarterly low: “If we recover $4,093 here, which is what I expect, we should have our quarterly low now and I would like to see $4,400 turned into support for the rise to all-time highs and beyond.”
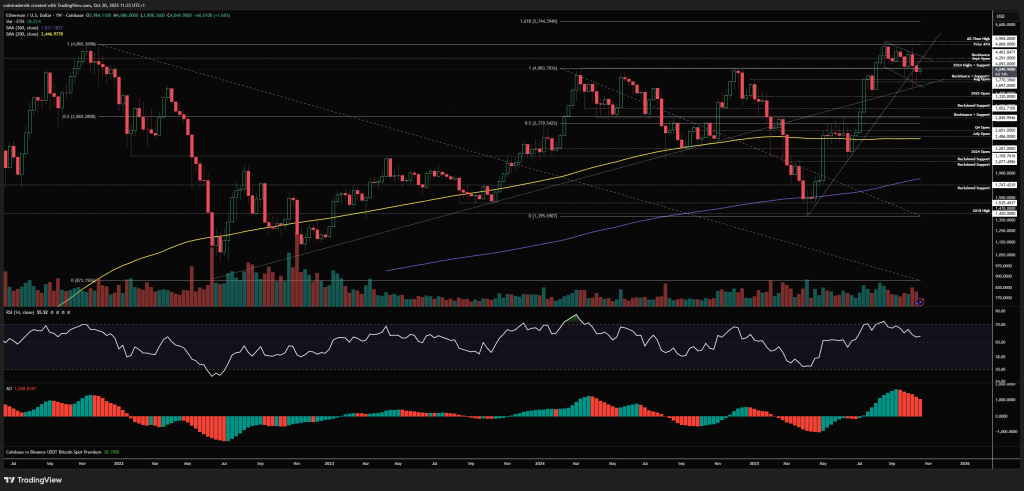
He set the weekly invalidation at $3,700, warning that a close below would put the annual open under scrutiny as “last resort support” for the bullish structure; failure there risks “a much greater return to $2,850.” Patel’s base case remained constructive: “acceptance returns above $4,093 next week, then a close above $4,400 for October, leading to new highs at $5,000 in early November and a very strong month for ETH.”
The daily ETH/USD reading connects this long-term plan to market dynamics and structure. Patel noted “an exhaustion of momentum towards the lows,” followed by a higher low last week, a formation that now needs to be defended. He wants to see the streak reaffirm with a push above the mid-range and a subsequent low above the weekly pivot: “We definitely want to see this structure now protected and price form a higher high above the mid-range at $4,352, then another low above $4,093 before a breakout higher and a push to new highs.
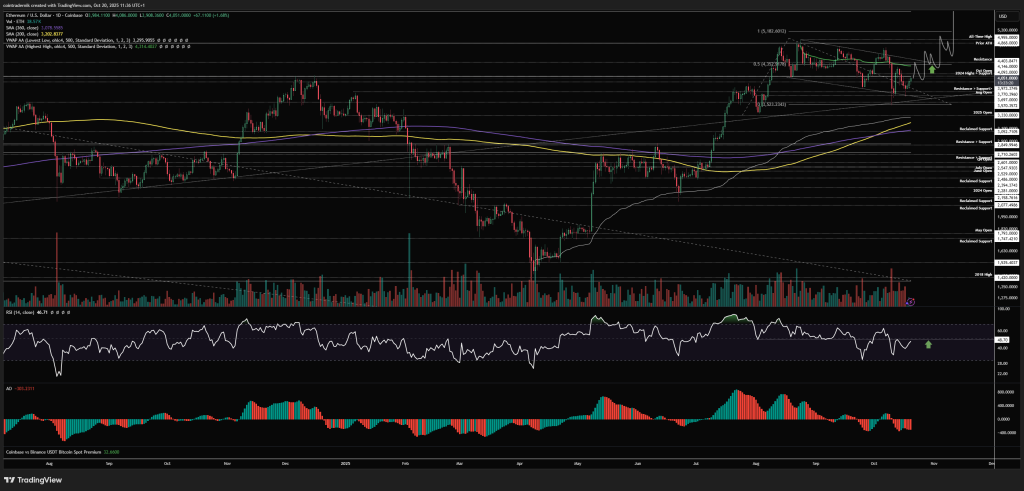
To confirm an impulsive leg, he pointed to a trendline breakout, a reversal of the ATH-anchored VWAP toward support, and a RSI regime shift: “If we get a trendline breakout and price flips the ATH-anchored VWAP toward support with a daily RSI above 50, I would expect a very rapid move toward $4,950, followed by price discovery in November. » The daily invalidation reflects the weekly logic: if $4,093 acts as resistance and the market goes below $3,700 – then closes below – “we absolutely retest the annual open,” according to him.
ETH vs. BTC
Against Bitcoin, Patel says the relative pair likely printed its Q4 low. On the weekly ETH/BTC chart, price was rejected at trendline resistance, then returned to the yearly open and held, closing “slightly green” while respecting trendline support from 2025 lows.
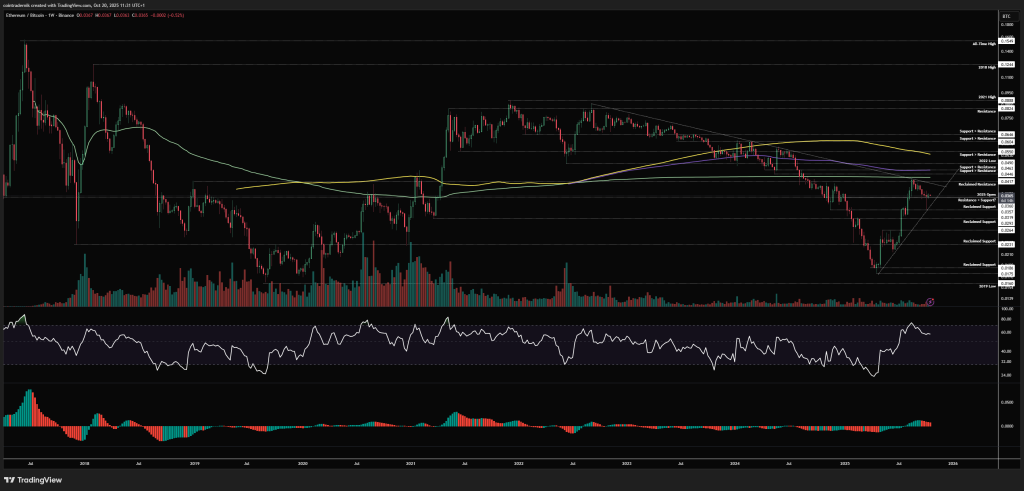
“I believe the fourth quarter low for the pair has formed here,” he wrote, adding that a retest and break above the descending boundary in early November would open the way for measured expansion: “acceptance above 0.0417 would open the next leg higher towards 0.055.” He placed the weekly invalidation at 0.0319.
Related reading
The daily ETH/BTC chart refines these signals into actionable levels. The price “marked this low between 0.0319 and the yearly open before rebounding strongly and reclaiming 0.036 as support.” Ideally, 0.036 now acts as a stepping stone; otherwise, Patel allows a low “above the 0.0319 level before continuing higher.”
The tactical cue would be a nearby supply reversal: “If we can reverse 0.0379 as support reclaimed here, that would be promising for the idea that a trendline breakout is imminent, after which I would expect 0.0417 to be pulled back and price to move higher, with minor resistance above 0.049 before 0.055.” He also identified a confluence band below: “We have a confluence of support between 0.0293 and 0.0319, so flipping this range into resistance would be very bearish ETH/BTC. »
Overall, Patel’s October 10 plan relies on three timings: ETH/USD must quickly recover and defend $4,093; $4,400 must be converted from cap to floor to clear runway to prior highs and a potential $4,950 extension; and ETH/BTC should cross 0.0379 then 0.0417 to confirm the extent of relative strength below any dollar-denominated breakout.
The downside is just as significant: failure to reclaim $4,093, a weekly close below $3,700, and a subsequent loss of the yearly open would validate the risk that, in Patel’s words, Ethereum could “return to $2,850.”
At press time, ETH was trading at $3,872.
Featured image created with DALL.E, chart from TradingView.com