A popular crypto analyst believes three indicators suggest Bitcoin (BTC) is far from its peak.
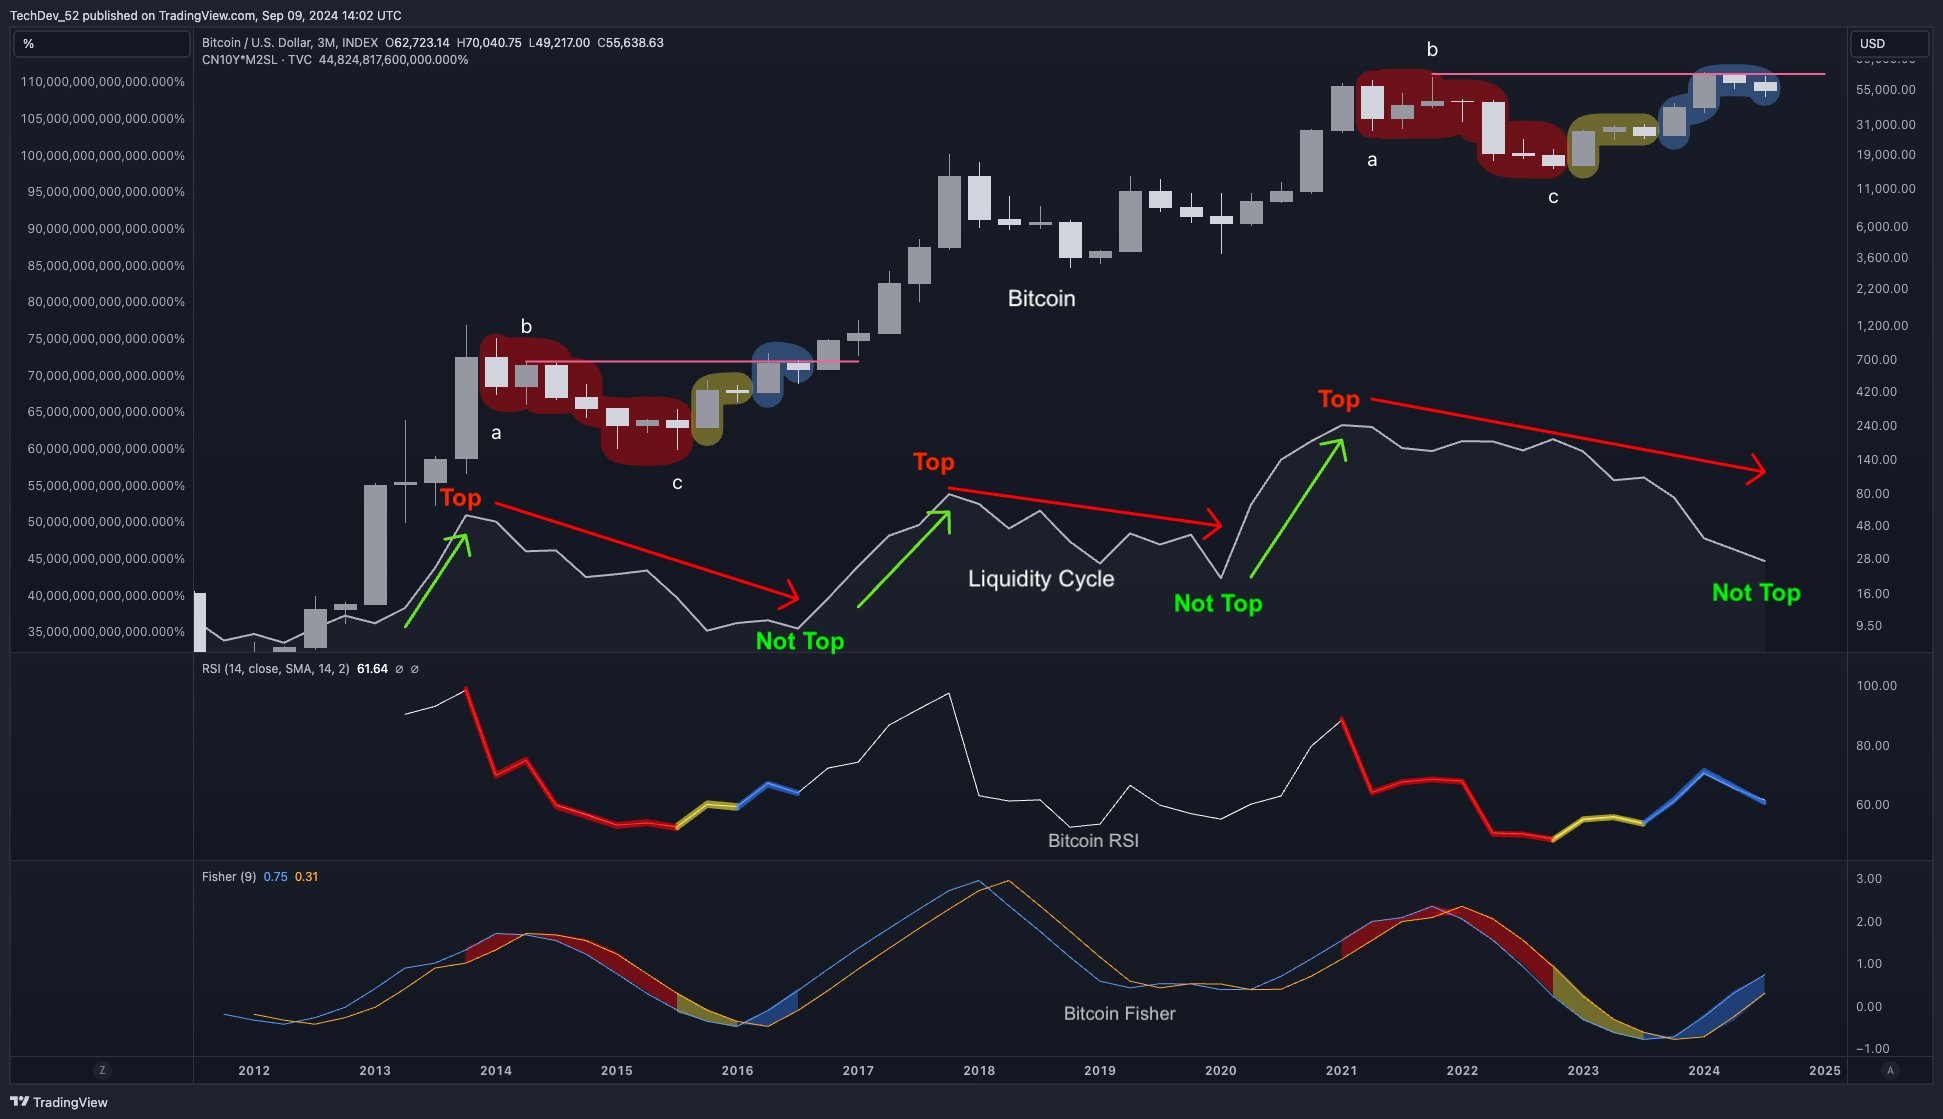
The pseudonymous crypto trader known as TechDev shares a chart with his 468,700 followers on social media platform X that plots the liquidity cycle, Bitcoin’s relative strength index (RSI), and BTC’s Fisher transform indicator.

TechDev’s first chart shows a line for the price of Bitcoin and a line that pits the Chinese 10-year bond (CN10Y) against the M2SL, the seasonally adjusted measure of the U.S. money supply.
From the trader’s chart, it seems to suggest that an expansion of CN10Y against M2SL could trigger big rallies in Bitcoin.
The RSI indicator is a momentum oscillator used to determine whether an asset is oversold or overbought. RSI values range from zero to 100, with a level between 70 and 100 indicating that an asset is overbought while a level from zero to 30 indicates that an asset is oversold.
TechDev also plots Bitcoin’s Fisher Transform indicator to identify trend reversals.
The analyst’s chart suggests that both the RSI and the Fisher Transform indicator are exhibiting patterns that resemble those that preceded BTC’s massive bull run in 2017.
At the time of writing, Bitcoin is trading at $57,793.
Don’t miss a thing – Subscribe to receive email alerts directly to your inbox
Check price
Follow us on XFacebook and Telegram
Surf the Daily Hodl Mix
 

Disclaimer: Opinions expressed on The Daily Hodl are not investment advice. Investors should do their own due diligence before making any high-risk investments in Bitcoin, cryptocurrencies or digital assets. Please be advised that your transfers and trades are at your own risk, and any losses you may incur are your responsibility. The Daily Hodl does not recommend the buying or selling of any cryptocurrencies or digital assets, nor is The Daily Hodl an investment advisor. Please note that The Daily Hodl participates in affiliate marketing.
Image generated: Midjourney


