Close Menu
Altcoin ObserverAltcoin Observer
  • Regulation
  • Bitcoin
  • Altcoins
  • Market
  • Analysis
  • DeFi
  • Security
  • Ethereum
Categories
  • Altcoins (3,196)
  • Analysis (3,320)
  • Bitcoin (3,935)
  • Blockchain (2,157)
  • DeFi (2,623)
  • Ethereum (2,625)
  • Event (119)
  • Exclusive Deep Dive (1)
  • Landscape Ads (2)
  • Market (2,714)
  • Press Releases (12)
  • Reddit (2,626)
  • Regulation (2,474)
  • Security (3,691)
  • Thought Leadership (3)
  • Videos (44)
Hand picked
  • 20% Bitcoin price crash brewing as analyst highlights possible bottom
  • MSFT-backed Space & Time launches Dreamspace based
  • Ethereum ETFs Hit 10-Day Inflow Streak: Demand Floors ETH Price
  • Alpha Compute Corp. provides update on GAMEE acquisition; Closing planned for May 2026 pending completion of the 2025 GAMEE financial audit
  • Bitcoin ETFs Pull $2.5B as Gold Funds Bleed in March
We are social
  • Facebook
  • Twitter
  • Instagram
  • YouTube
Facebook X (Twitter) Instagram
  • About us
  • Disclaimer
  • Terms of service
  • Privacy policy
  • Contact us
Facebook X (Twitter) Instagram YouTube LinkedIn
Altcoin ObserverAltcoin Observer
  • Regulation
  • Bitcoin
  • Altcoins
  • Market
  • Analysis
  • DeFi
  • Security
  • Ethereum
Events
Altcoin ObserverAltcoin Observer
Home»Market»Three Indicators Signal Bitcoin (BTC) Bull Market Is In Early Stages Of Parabolic Advance, Analyst Says
Market

Three Indicators Signal Bitcoin (BTC) Bull Market Is In Early Stages Of Parabolic Advance, Analyst Says

September 13, 2024No Comments
Share Facebook Twitter Pinterest LinkedIn Tumblr Reddit Telegram Email
Three Btc Bull Early.jpg
Share
Facebook Twitter LinkedIn Pinterest Email


A popular crypto analyst believes three indicators suggest Bitcoin (BTC) is far from its peak.

The pseudonymous crypto trader known as TechDev shares a chart with his 468,700 followers on social media platform X that plots the liquidity cycle, Bitcoin’s relative strength index (RSI), and BTC’s Fisher transform indicator.

Source: TechDev/X

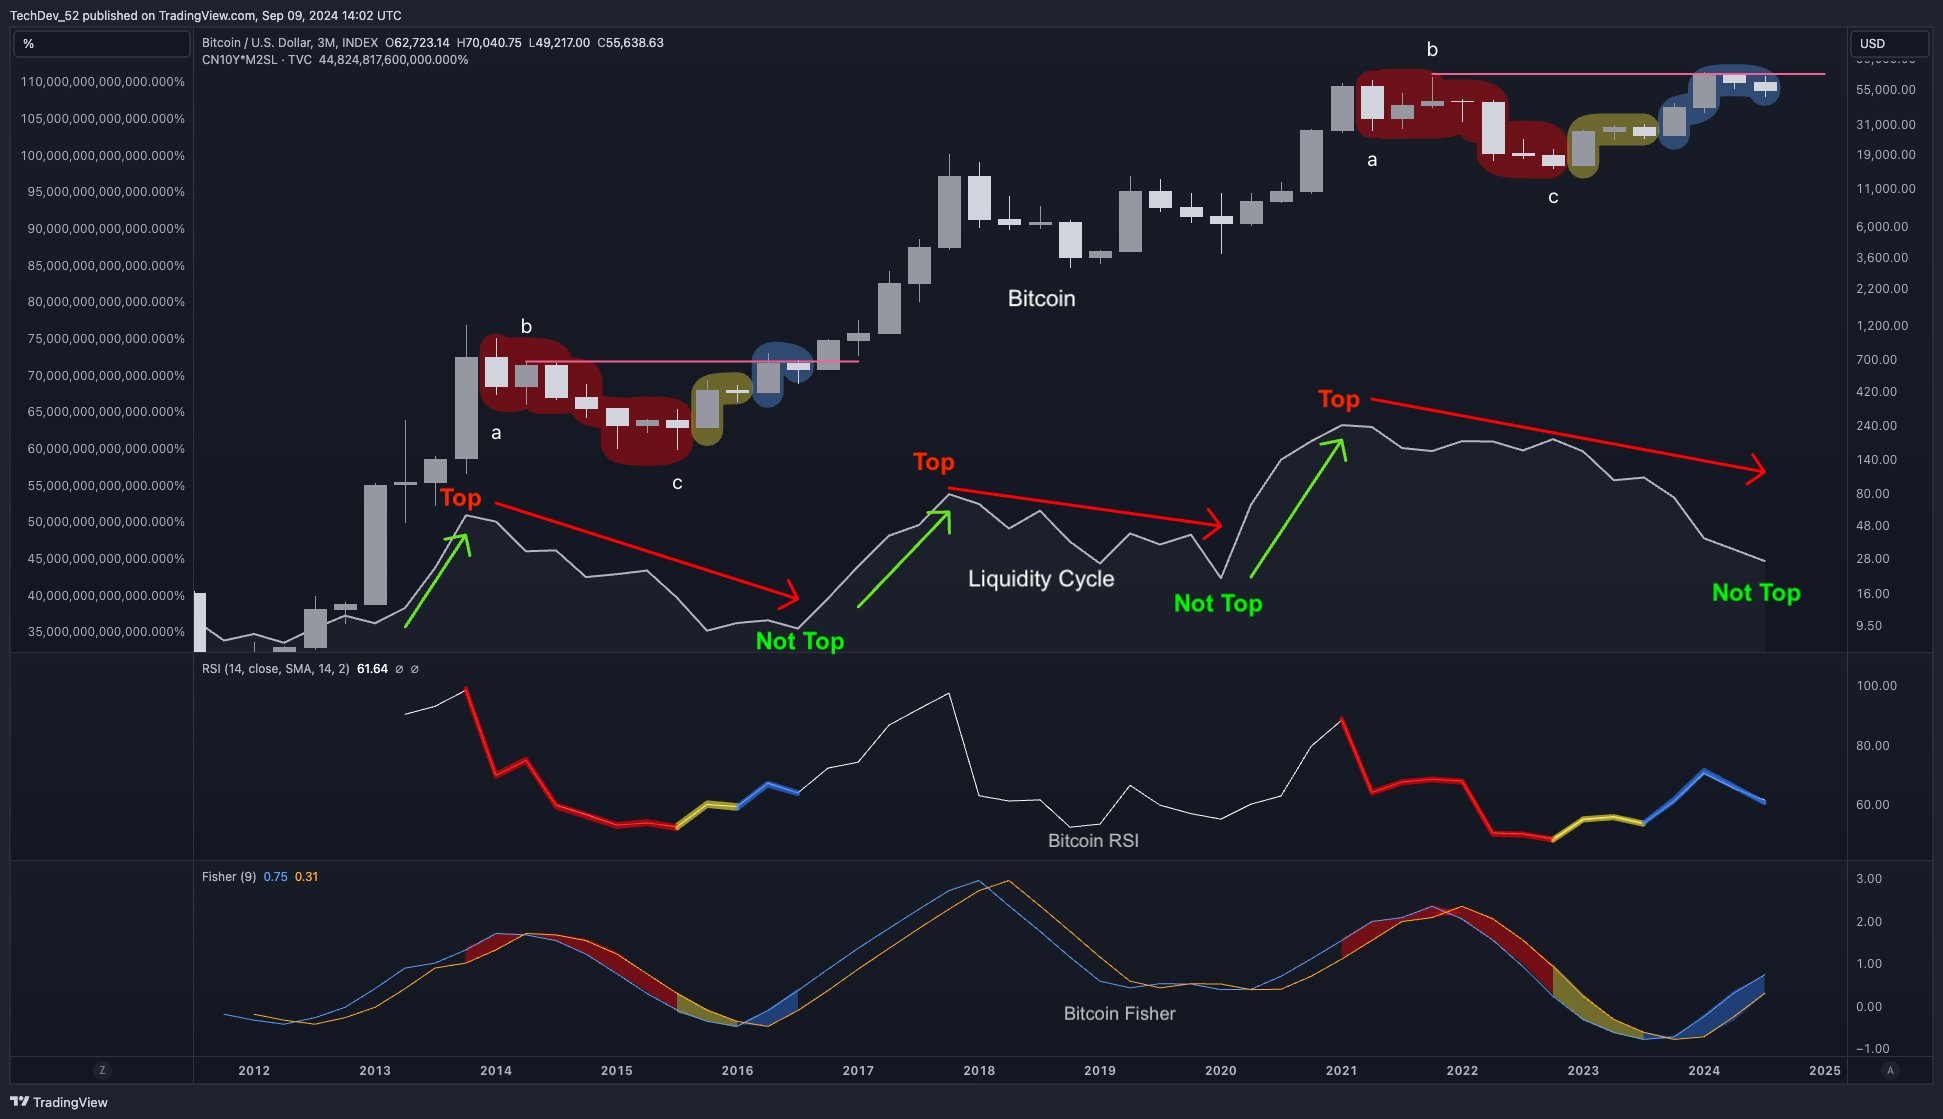
TechDev’s first chart shows a line for the price of Bitcoin and a line that pits the Chinese 10-year bond (CN10Y) against the M2SL, the seasonally adjusted measure of the U.S. money supply.

From the trader’s chart, it seems to suggest that an expansion of CN10Y against M2SL could trigger big rallies in Bitcoin.

The RSI indicator is a momentum oscillator used to determine whether an asset is oversold or overbought. RSI values ​​range from zero to 100, with a level between 70 and 100 indicating that an asset is overbought while a level from zero to 30 indicates that an asset is oversold.

TechDev also plots Bitcoin’s Fisher Transform indicator to identify trend reversals.

The analyst’s chart suggests that both the RSI and the Fisher Transform indicator are exhibiting patterns that resemble those that preceded BTC’s massive bull run in 2017.

At the time of writing, Bitcoin is trading at $57,793.

Don’t miss a thing – Subscribe to receive email alerts directly to your inbox

Check price

Follow us on XFacebook and Telegram

Surf the Daily Hodl Mix

&nbsp

Disclaimer: Opinions expressed on The Daily Hodl are not investment advice. Investors should do their own due diligence before making any high-risk investments in Bitcoin, cryptocurrencies or digital assets. Please be advised that your transfers and trades are at your own risk, and any losses you may incur are your responsibility. The Daily Hodl does not recommend the buying or selling of any cryptocurrencies or digital assets, nor is The Daily Hodl an investment advisor. Please note that The Daily Hodl participates in affiliate marketing.

Image generated: Midjourney


Source link

Share. Facebook Twitter Pinterest LinkedIn Tumblr Email
Previous ArticleCoinbase Directs $18 Billion Bitcoin Pool Toward DeFi With New BTC Variant – DL News
Next Article Coinbase CEO Brian Armstrong Says Clear Cryptocurrency Regulation Could Boost Capital Inflows

Related Posts

Market

New Bull Market May Be About to Begin, Says Owen Lau

March 8, 2026
Market

why the crypto market is crashing — TradingView News

March 8, 2026
Market

The US crypto market in 2026: the change no one expected

March 8, 2026
Add A Comment
Leave A Reply Cancel Reply

Single Page Post
Share
  • Facebook
  • Twitter
  • Instagram
  • YouTube
Featured Content
Event

Dutch Blockchain Week 2026 strengthens position as Europe’s leading B2B blockchain event week

April 14, 2026

Amsterdam, April 2026 – Dutch Blockchain Week 2026 is rapidly evolving into one of Europe’s…

Event

Global Games Show Riyadh: The Ultimate Creator & Influencer Hub

March 31, 2026

The fast-evolving gaming ecosystem of Riyadh is powered by solid national investment, a flourishing esports…

1 2 3 … 82 Next
  • Facebook
  • Twitter
  • Instagram
  • YouTube

MSFT-backed Space & Time launches Dreamspace based

April 24, 2026

Pavel Durov announces 6x fee reduction for TON, “Regardless of…”

April 24, 2026

STABLE’s 11% Price Hike – How High Can Adoption Trends and Market Demand Go?

April 24, 2026
Facebook X (Twitter) Instagram LinkedIn
  • About us
  • Disclaimer
  • Terms of service
  • Privacy policy
  • Contact us
© 2026 Altcoin Observer. all rights reserved by Tech Team.

Type above and press Enter to search. Press Esc to cancel.

bitcoin
Bitcoin (BTC) $ 77,740.00
ethereum
Ethereum (ETH) $ 2,315.16
tether
Tether (USDT) $ 1.00
xrp
XRP (XRP) $ 1.44
bnb
BNB (BNB) $ 638.08
usd-coin
USDC (USDC) $ 0.999815
solana
Solana (SOL) $ 86.21
tron
TRON (TRX) $ 0.324163
figure-heloc
Figure Heloc (FIGR_HELOC) $ 1.03
staked-ether
Lido Staked Ether (STETH) $ 2,265.05