


Join our Telegram channel to stay up to date with the latest news
The price of Bitcoin edged up a fraction of a percent over the past 24 hours to trade at $86,640 as of 2:40 a.m. EST on trading volume that fell 11% to $44.8 billion.
This comes as perennial BTC bear Peter Schiff warned of a BTC crash, with money flowing back into traditional safe havens like gold and silver.
“The first casualty of the gold and silver surge will likely be Bitcoin,” Schiff said in an X article. “Before a US dollar crash, we will likely have a Bitcoin crash”
Meanwhile, Bloomberg commodities strategist Mike McGlone says the price of Bitcoin could fall to $10,000.
A Path to $10,000 Bitcoin –
“We are buying Bitcoin with money we cannot afford to lose.” Michael Saylor, at the Economic Club of Miami event last night.
I admire and respect Mr. Saylor, and it was his arrival in 2020 – when Bitcoin was trading at nearly $10,000 – that helped fuel the 10x… pic.twitter.com/0CDBxCZYYc-Mike McGlone (@mikemcglone11) December 16, 2025
McGlone says positive catalysts such as the launch of spot Bitcoin ETFs, recognition of Bitcoin’s benefits by U.S. leaders, and broader adoption by the general public have all occurred, suggesting the market will be short of encouraging future developments.
Meanwhile, U.S. spot BTC ETFs saw their second day of outflows this week, with investors selling about 3,210 BTC worth about $277.2 million on Tuesday, according to coin mechanism.
Bitcoin price faces bearish pressure after losing key support
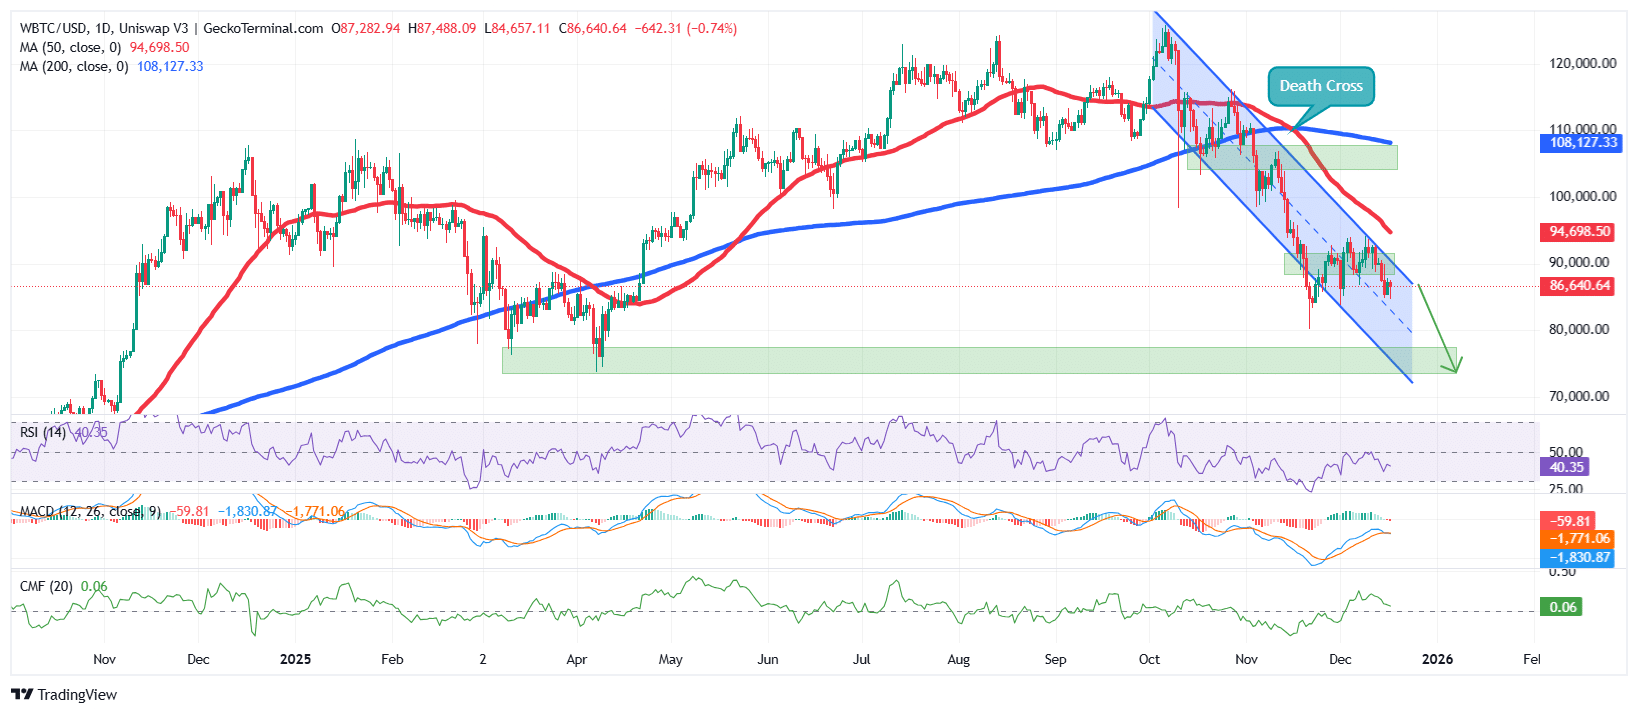
According to the BTC/USD chart analysis on the daily time frame, the BTC Price is currently in a descending bearish channel pattern.
After hitting an all-time high (ATH) around $126,200 in October, Bitcoin then corrected into the downtrend channel, as investors took profits on April’s bullish surge from $74,000 to its ATH.
Sustained bearish pressure was further reinforced by a deadly crossover around $110,400, as the 200-day simple moving average (SMA) crossed above the 50-day SMA.
This then pushed the BTC price below both SMAs, supporting the long-term bearish stance.
BTC has now lost the $88,200 support zone, which keeps the price in a consolidation zone, capped by the $94,000 resistance zone.
The Relative Strength Index (RSI) supports the bearish narrative, with the RSI now falling towards the oversold level of 30, currently at 40, and continuing to fall.
Additionally, the blue Moving Average Convergence Divergence (MACD) line has moved below the orange signal line, and the red histogram bars are now forming below the neutral line, signaling that Bitcoin price has lost momentum.
BTC Price Prediction
Based on BTC price analysis, the asset turned bearish after losing support at $88,200. With negative RSI and MACD indicators, BTC could continue to fall, with the next key support around $74,200 in the long term.
Ali Martinez, a prominent crypto analyst at
Every time the SuperTrend sells off on the weekly chart, Bitcoin $BTC always responded with a significant price drop.
– February 2014: -75%
– January 2018: -73%
– October 2019: -54%
– May 2021: -38%
– January 2022: -67% pic.twitter.com/nj0TTDtXP7– Ali Charts (@alicharts) December 16, 2025
Conversely, if bulls defend the $85,000 zone, Bitcoin could move higher, with the 50-day SMA at $94,698 acting as an immediate target and resistance zone.
The bullish scenario could be supported by the Chaikin Money Flow (CMF), which is slightly positive, suggesting a slight inflow of capital and indicating that buyers are still present but without firm conviction, suggesting weak accumulation rather than a strong bullish push.
Related news:
Best Wallet – Diversify your crypto portfolio

- Easy-to-use, feature-driven crypto wallet
- Get Early Access to Upcoming Token ICOs
- Multi-chain, multi-wallet, non-custodial
- Now on App Store, Google Play
- Stake to win a $BEST native token
- More than 250,000 active users per month
Join our Telegram channel to stay up to date with the latest news