


Ethereum is testing resistance as the market finds some relief. The price is at a decision point. And a CryptoQuant analyst has identified a supply structure below this resistance that has no precedent in the current cycle – and is clear in the cycle before it.
The analyst’s data reveals a 57% collapse in Ethereum’s exchange supply: reserves fell from around 35 million ETH to 14.9 million ETH – a reduction that leaves far less ETH available for immediate sale than at any comparable point during the 2020-2021 period. The pieces have not disappeared. They have been placed in the custody of holders who do not send them to the stock exchange to sell them.

The influx data confirms the behavioral picture. Exchange flows have increased recently – but the scale remains significantly lower than the highs at the top of the 2021-2022 cycle, when inflows approached the 10-20 million ETH range. The current clusters represent only a fraction of these peaks. The large-scale distribution – that which characterized the peak of the previous cycle – is not present in the data.
Ethereum testing resistance with salable supply 57% lower than its previous cycle peak, and without the distribution behavior that accompanied that peak, is a structurally different test. Overhead exists. The ammunition to support it is historically thin.
Two signals. A conclusion
The analyst’s framework is based on the relationship between two independent data points that are currently moving in a pattern that has historically mattered. The first is what happened to exchange reserves: a 57% collapse that removed the majority of the immediately available supply of ETH for sale from the market.
The second reason is what didn’t happen to exchange flows: the extreme spikes in deposits – 10 to 20 million ETH – that characterized the 2021-2022 distribution phase have not returned. Holders do not flood ETH exchanges to make profits or cut losses on a large scale.

This combination – supply depleted, distribution absent – describes a market where downward structural pressure has been significantly reduced without the structural signal of panic that typically accompanies cycle dips at their sharpest point. The market is not experiencing forced selling on a scale comparable to previous major lows. It is the experience of calm.
The price context adds the final dimension. Ethereum is currently approaching the lows of previous correction ranges – the price levels that in previous cycles represented the area where the risk-reward balance shifted in favor of patient capital rather than continued selling.
The analyst calls it cautiously: a constructive signal in current conditions. Not a confirmation. Not a guarantee. A structural alignment between depleted supply, absent distribution pressure, and historically significant price levels that, taken together, describe a market where recovery conditions are present even if the catalyst has not yet arrived.
Ethereum Recovers Weekly Pivot as Recovery Test Structure
Ethereum is trading between $2,350 and $2,400 on the weekly time frame, reclaiming a key pivot level that has repeatedly acted as support and resistance throughout the current cycle. After the sharp decline in early 2026, ETH staged a recovery from the $1,600-$1,800 region, where strong demand emerged and halted the decline.
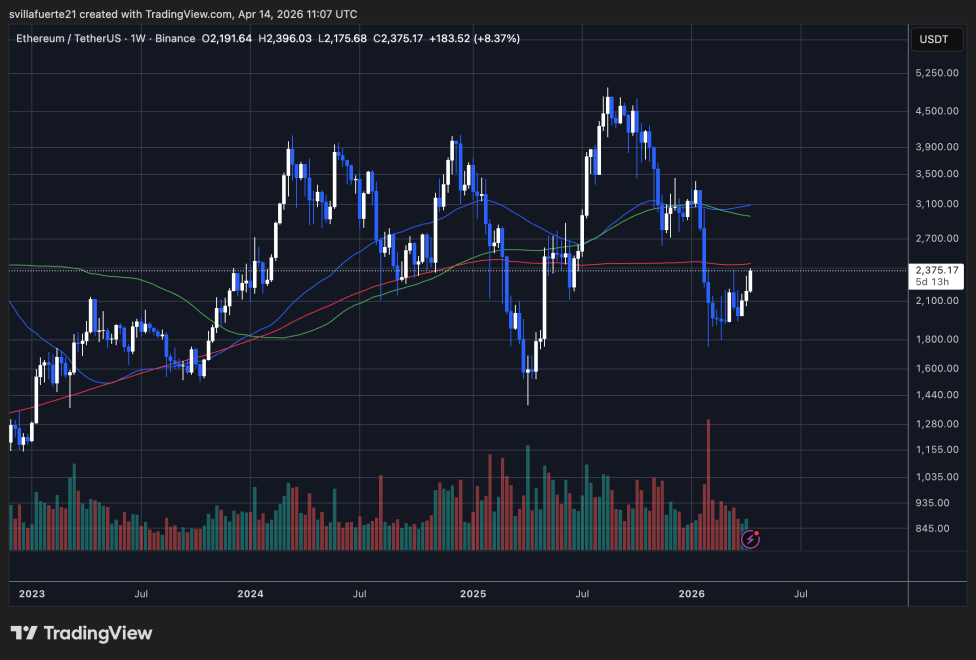
The current structure reflects a market that is trying to return to equilibrium. Price is now interacting with the 100-week (green) and 200-week (red) moving averages, which are converging towards the $2,300 area. This zone represents a critical technical threshold: its recovery suggests stabilization, while failure would reinforce the broader corrective trend.
The 50-week moving average (blue) flattens and begins to rise, indicating improving short-term momentum. However, ETH has yet to set a clearly higher high on the weekly timeframe, leaving the recovery unconfirmed.
Volume patterns remain consistent with a post-surrender environment. The spike during the selloff indicates forced liquidations, while the subsequent normalization suggests a reduction in tensions but not a strong accumulation.
Structurally, Ethereum is at a decision point. Sustained acceptance above $2,400 would open the way towards $2,800 – $3,100, while rejection would likely take the price back towards the $2,000 support zone.
Featured image from ChatGPT, chart from TradingView.com
Editorial process as Bitcoinist focuses on providing thoroughly researched, accurate and unbiased content. We follow strict sourcing standards and every page undergoes careful review by our team of top technology experts and seasoned editors. This process ensures the integrity, relevance and value of our content to our readers.