


Bitcoin is reaching the upper boundary of a two-month ascending channel near $77,500, with the MACD 4H histogram turning negative at the trendline and the April 28-29 FOMC meeting serving as the next major catalyst. This article examines the technical structure, key levels, and on-chain data shaping Bitcoin’s next directional move.
Summary
- Bitcoin reaches the upper boundary of a 4H ascending channel near $77,500 as the MACD histogram turns negative at -183.29.
- The SMA ribbon remains bullish below price, but momentum slows at the trendline.
- A confirmed H4 close above $80,000 targets the 200-day SMA near $85,000; rejection risks a pullback to $75,721.
Bitcoin (BTC) is trading at around $76,863 on April 27, up less than 1% on the session, after briefly touching $77,067 during Asian hours. The asset has climbed nearly 30% from its February low near $59,000 inside a well-defined ascending channel, but it is now pressing the upper boundary of that structure at the same time as the MACD 4H histogram turns deeply negative, creating directional tension that the April 28-29 FOMC meeting may finally resolve.
Bitcoin Ascending Channel Reaches Critical Moment
The 4H chart shows Bitcoin constructing a classic ascending channel, defined by two ascending parallel trendlines, from the February low near $59,000. The trend resulted in a sequence of higher highs and higher lows over about two months, with the price now at the upper boundary near $77,500, where previous tests stalled.
The moving average ribbon remains constructively positioned. The 20 SMA stands at $77,691, the 50 SMA at $77,204, the 100 SMA at $75,721, and the 200 SMA at $72,145, all layered below the price in a bullish order that has supported the entire rally.
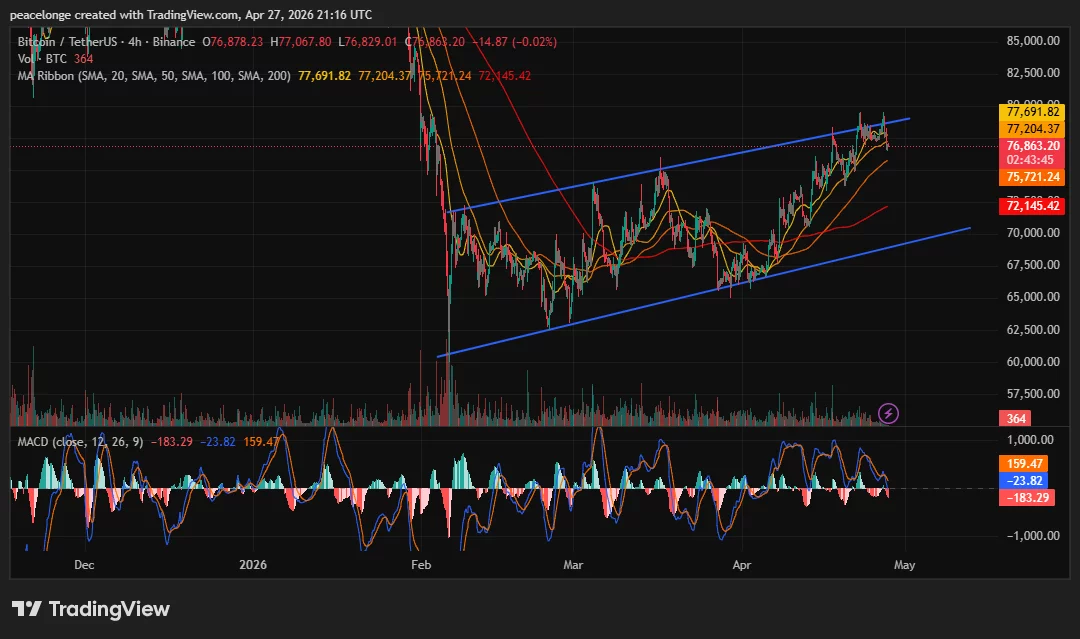
However, the MACD indicator sends a warning signal. The MACD line reads 159.47 with a signal line at -23.82, producing a histogram of -183.29. A negative histogram at the channel’s upper trendline indicates that bullish momentum is decelerating rather than accelerating, a trend that in previous channel tests has preceded a consolidation or brief pullback rather than an immediate breakout. Crypto analyst Ali Martinez said on
Key levels: support, resistance and price targets
Immediate resistance lies at the upper channel trendline between $77,500 and $78,000, which is the level that capped Bitcoin during the 11-week high test on April 22. Above that, the $80,000 round number is the main bull case target and the level that would confirm a breakout of the channel. A 4-month close above $80,000 with volume expansion would pave the way towards the 200-day SMA near $85,000, the threshold identified by analysts as separating the dominant corrective trend from a confirmed structural reversal.
On the other hand, the 100 SMA at $75,721 constitutes the first significant support at the close. A 4-hour close below this level removes support from the intermediate channel and exposes the lower boundary of the ascending channel between $72,000 and $73,000, where the 200 SMA at $72,145 converges. A daily close below this zone completely invalidates the ascending channel structure and shifts the short-term bearish bias.
Collection of ETFs and positioning of derivative products
The rally towards the upper boundary of the channel was supported by a historic institutional inflow sequence. According to data tracked by crypto.news, spot Bitcoin ETFs saw an eight-day inflow streak totaling $2.43 billion through April 23, with BlackRock’s IBIT absorbing $907.97 million in the week of April 13-17 alone. April’s total inflows are already nearly double the $1.32 billion collected in March.
Despite strong institutional supply, on-chain data from Glassnode indicates that short-term holders are using ETF demand as exit liquidity near the $78,000 to $80,100 range, levels that have repeatedly capped rallies in 2026. Bitcoin futures open interest fell more than 6% in the 24 hours surrounding the most recent test of $78,000, according to data from CoinGlass, pointing to leverage on the rollout rather than further long accumulation at resistance.
The FOMC, the next decisive catalyst
The April 28-29 FOMC meeting is the key macroeconomic event likely to resolve the canal problem one way or the other. As crypto.news reported, CME FedWatch shows a 98% chance of holding rates, making the tone of Chairman Jerome Powell’s press conference the key variable. A dovish signal involving rate cuts in the second half of 2026 would reduce the opportunity cost of holding BTC and could serve as a catalyst for a close above $80,000. A neutral or hawkish tone would likely prolong the channel’s consolidation and increase the likelihood of a pullback toward the channel’s intermediate support.
If Bitcoin maintains the ascending channel and clears $80,000 in volume after the FOMC results, the 200-day SMA near $85,000 becomes the next structural test for a confirmed trend reversal.