




Close Menu
Altcoin ObserverAltcoin Observer
  • Regulation
  • Bitcoin
  • Altcoins
  • Market
  • Analysis
  • DeFi
  • Security
  • Ethereum
Categories
  • Altcoins (3,732)
  • Analysis (3,840)
  • Bitcoin (4,470)
  • Blockchain (2,157)
  • DeFi (2,623)
  • Ethereum (2,773)
  • Event (119)
  • Exclusive Deep Dive (1)
  • Landscape Ads (2)
  • Market (2,714)
  • Press Releases (12)
  • Reddit (2,847)
  • Regulation (2,474)
  • Security (4,103)
  • Thought Leadership (3)
  • Videos (44)
Hand picked
  • Uniswap RFC explores running private exchanges using v4 and UniswapX hooks
  • Australia targets Telegram a day after Russia indicts Durov
  • Bitcoin’s weak hands fold
  • Success Story: Jonathan Nichols’ Learning Journey with 101 Blockchains
  • Kraken Cyprus honored at the 14th Invest Cyprus International Investment Awards
We are social
  • Facebook
  • Twitter
  • Instagram
  • YouTube
Facebook X (Twitter) Instagram
  • About us
  • Disclaimer
  • Terms of service
  • Privacy policy
  • Contact us
Facebook X (Twitter) Instagram YouTube LinkedIn
Altcoin ObserverAltcoin Observer
  • Regulation
  • Bitcoin
  • Altcoins
  • Market
  • Analysis
  • DeFi
  • Security
  • Ethereum
Events
Altcoin ObserverAltcoin Observer
Home»Analysis»Analyst Predicts Bitcoin Price Rise to $500,000 as Ribbon Fractal Emerges
Analysis

Analyst Predicts Bitcoin Price Rise to $500,000 as Ribbon Fractal Emerges

February 26, 2026No Comments
Share Facebook Twitter Pinterest LinkedIn Tumblr Reddit Telegram Email
Share
Facebook Twitter LinkedIn Pinterest Email


A prominent market commentator has projected that Bitcoin price could surge as high as $500,000, citing the reappearance of a long-seen moving average ribbon pattern on the monthly chart. The forecast, shared by Egrag Crypto on

Bitcoin Price Ribbon Setup Signals Expansion Phase

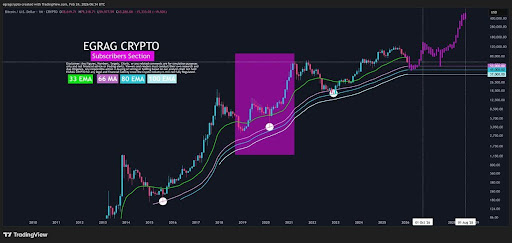
At the center of the $500,000 forecast is the reformation of a multi-layer moving average ribbon over a period of one month. The chart provided by the analyst shows the 33 EMA, 66 MA, 80 EMA, and 100 EMA compressing and beginning to expand into a pattern that has historically marked major cycle transitions.

Related reading
XRP Price Rise
Source:

This structure is not presented in isolation. In previous cycles, similar ribbon squeezes were followed by decisive impulsive advances. Analyst highlights an earlier period on the chart when the price consolidated inside the ribbon before abruptly accelerating upward, forming a pattern that now appears to repeat itself. Because this pattern reflects the behavior of the previous cycle, he characterizes it as a fractal, indicating a structural similarity between different market phases.

The position of the ribbon relative to current price action reinforces the broader thesis. Bitcoin remains structurally above averages at multiple levels, a condition that in previous cycles preceded a sustained rise rather than a distribution. When price recovered and held above this cluster in the past, expansion phases followed. Based on these historical expansion multiples, the analyst sets an intermediate target near $150,000 and extends the upper limit of the move towards $500,000.

This framework deliberately diverts attention from sentiment-related fluctuations. Instead, moving averages are treated as objective markers of Bitcoin’s position in its long-term cycle, forming the analytical basis for the half-million dollar projection.

Calendar window points to alignment in 2026 and late 2028

Based on the structural case, the forecasts also include a defined timeline. The chart highlights October 2026 as a key waypoint, aligning with a potential continuation phase if the emerging ribbon fractal develops in line with historical precedent.

Beyond this initial window, a second period is identified towards the end of the third quarter or the beginning of the fourth quarter of 2028. The analyst refers to electoral cycles as a contextual factor, suggesting that macro-narrative and technical structure could converge during this period.

Related reading

The projected path on the chart reflects this stepwise process. Rather than a simple vertical thrust, it describes a series of consolidations followed by accelerationsechoing previous cycles before maximum expansion.

By integrating the price structure into the calendar, the projection defines the $500,000 target as the high point of a reproducible cyclical model. In this context, the ribbon fractal is positioned not as speculative optimism, but as the structural roadmap that underpins the analyst’s expectations of a potential rise towards half a million dollars.

Bitcoin Price Chart from Tradingview.com
BTC clears $68,000 | Source: BTCUSD on Tradingview.com

Featured image created with Dall.E, chart from Tradingview.com


Source link

Share. Facebook Twitter Pinterest LinkedIn Tumblr Email
Previous ArticleEnterprise Ethereum Alliance Forms Privacy Working Group for Enterprise Adoption
Next Article Wall Street, leader in retail trade? Institutions Flooded Ethereum Ahead of 15% Price Rally

Related Posts

Analysis

Bitcoin’s weak hands fold

July 30, 2026
Analysis

CLARITY Act Delay Shows Fight Against Crypto Market Structure Is Not Over

July 30, 2026
Analysis

CLARITY Act delay risks taking US lead on crypto, lawmaker warns

July 28, 2026
Add A Comment
Leave A Reply Cancel Reply

Single Page Post
Share
  • Facebook
  • Twitter
  • Instagram
  • YouTube
Featured Content
Event

Dutch Blockchain Week 2026 strengthens position as Europe’s leading B2B blockchain event week

April 14, 2026

Amsterdam, April 2026 – Dutch Blockchain Week 2026 is rapidly evolving into one of Europe’s…

Event

Global Games Show Riyadh: The Ultimate Creator & Influencer Hub

March 31, 2026

The fast-evolving gaming ecosystem of Riyadh is powered by solid national investment, a flourishing esports…

1 2 3 … 82 Next
  • Facebook
  • Twitter
  • Instagram
  • YouTube

Australia targets Telegram a day after Russia indicts Durov

July 30, 2026

Ethena whales withdraw 102 million tokens from exchanges: has ENA selling pressure eased?

July 30, 2026

Audiera loses KEY support – can BEAT recover from 24% crash?

July 29, 2026
Facebook X (Twitter) Instagram LinkedIn
  • About us
  • Disclaimer
  • Terms of service
  • Privacy policy
  • Contact us
© 2026 Altcoin Observer. all rights reserved by Tech Team.

Type above and press Enter to search. Press Esc to cancel.

bitcoin
Bitcoin (BTC) $ 75,686.00
ethereum
Ethereum (ETH) $ 2,230.19
tether
Tether (USDT) $ 0.999042
bnb
BNB (BNB) $ 695.10
xrp
XRP (XRP) $ 1.16
usd-coin
USDC (USDC) $ 0.999603
solana
Solana (SOL) $ 89.18
tron
TRON (TRX) $ 0.319881
staked-ether
Lido Staked Ether (STETH) $ 2,265.05
figure-heloc
Figure Heloc (FIGR_HELOC) $ 1.03