




Ether.fi (ETHFI) saw a sharp decline, with market-wide outflows accounting for much of the fall.
The asset posted a double-digit loss early Tuesday, extending its price to a chart low of $0.384. Capital outflows continue to dominate, but the market is already showing the first signs of a possible recovery and leaves the possibility of a rally that could extend further upwards.
Capital leaves the ETHFI on-chain economy
The most significant obstacle the ETHFI price faced over the past day was the on-chain capital outflow.
Total Value Locked (TVL), which gauges the strength of on-chain capital across deposits and withdrawals via the protocol, shows that approximately $54 million has left the market.
The metric rose from $3.212 billion to about $3.153 billion, signaling that retail holders are exiting the market, likely due to concerns about increasing volatility.
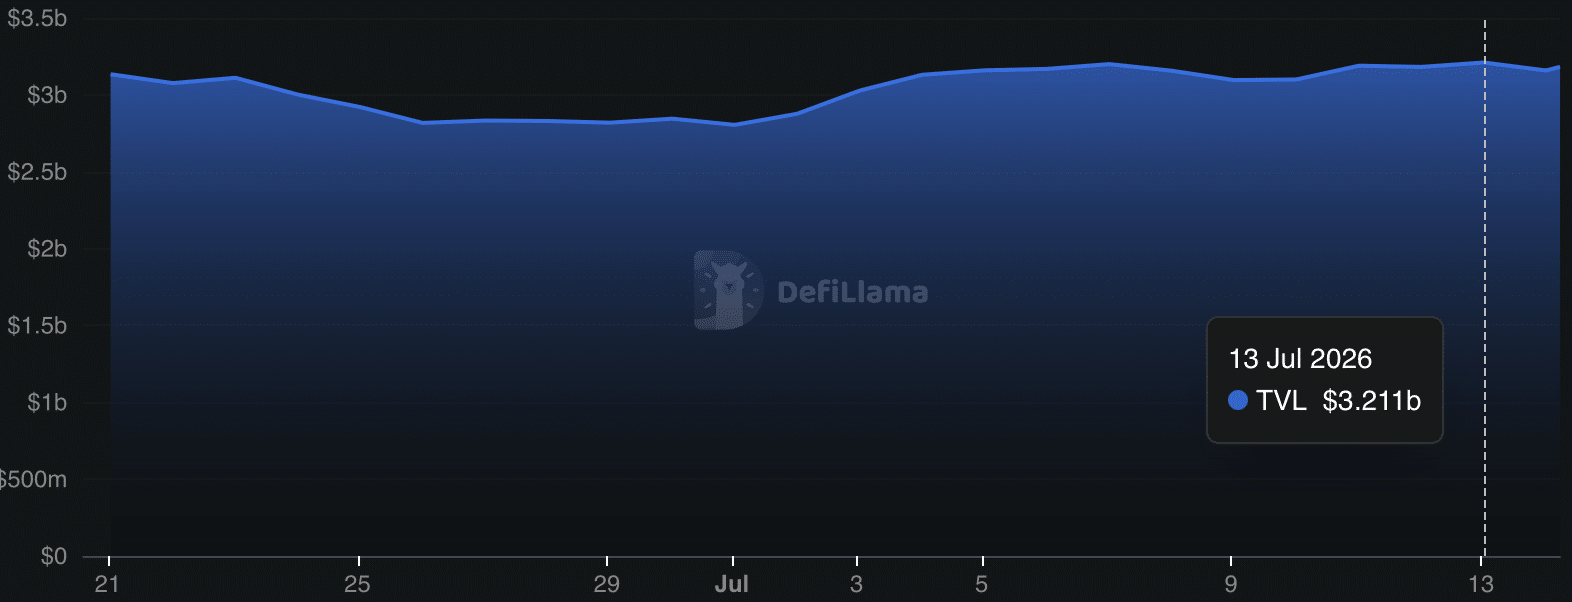
Protocol-wise, the asset has held up well, with profits – the profit that remains after incentives are removed – reaching $1.34 million and already close to half of the $2.79 million generated in June.
The trend suggests that the recent sell-off reflects a reaction to market sentiment and not a structural downtrend. This sentiment dates back to the notable decline that the crypto market absorbed over the past day, when it lost approximately $8.61 billion in total capitalization.
Perpetual contracts keep bears in play
The market’s most obvious gap appears in ETHFI perpetual contracts, which show the bears retaining some strength after an 11% decline sent open interest to $62.26 million.
This gap comes from an imbalance in liquidations, with market data revealing a large disparity between long and short liquidations. Over the past 24 hours, long traders have lost approximately 40 times more than short traders.
Liquidation data shows that short traders lost just $2,210 compared to $89,680 for long traders over the same period, and the uneven spread speaks to the strength of the bears.
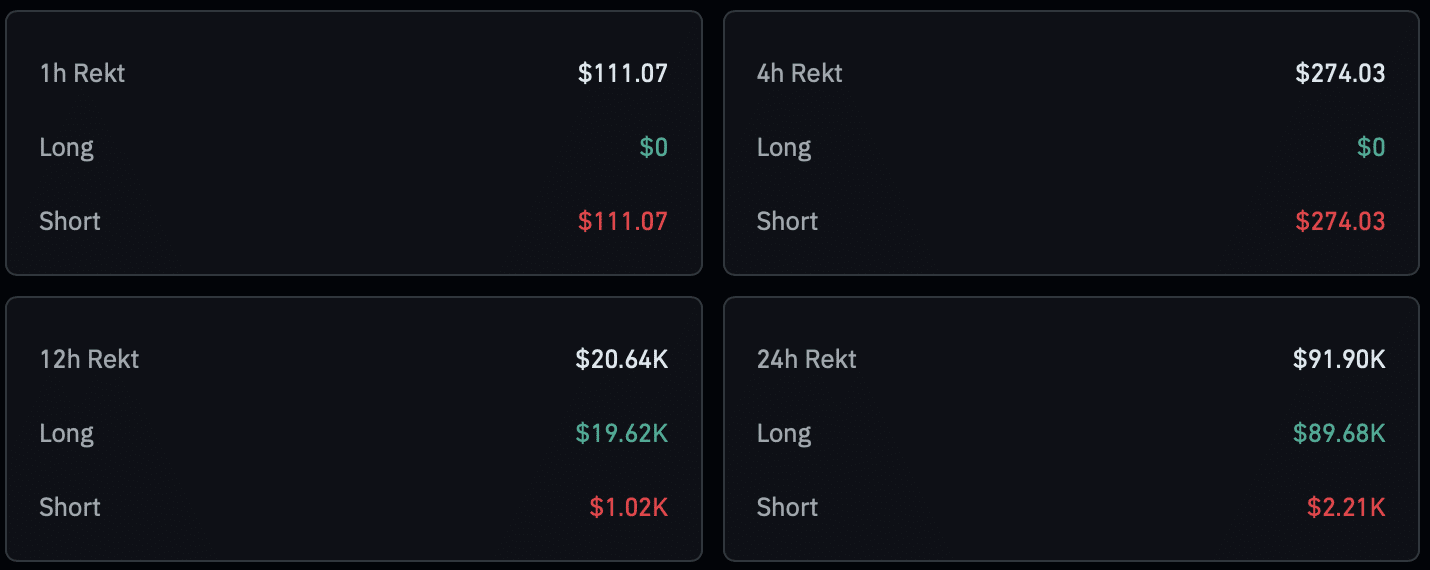
Over shorter periods, the disparity in liquidation widens further, even if the capital lost this time remains minimal.
The liquidation heat map offers no clear directional bias for the asset, instead showing fairly evenly distributed clusters.
These clusters mark the areas of the chart where buy or sell orders are located, and the clusters above the price generally act as sell zones that pull the price towards them and force selling, while the clusters below reverse the momentum and force purchases once the price drops there.
As of now, there is no decisive direction, letting momentum dictate the next price movement.
Rising Long Volumes Hint at ETHFI Accumulation
Although liquidations remain skewed toward short positions, activity on the long/short ratio indicates increasing accumulation.
At the time of writing, the long/short volume ratio on the chart shows longer volume in the market, pushing up to 1.02. A continued rise would imply that buying interest persists in the market.
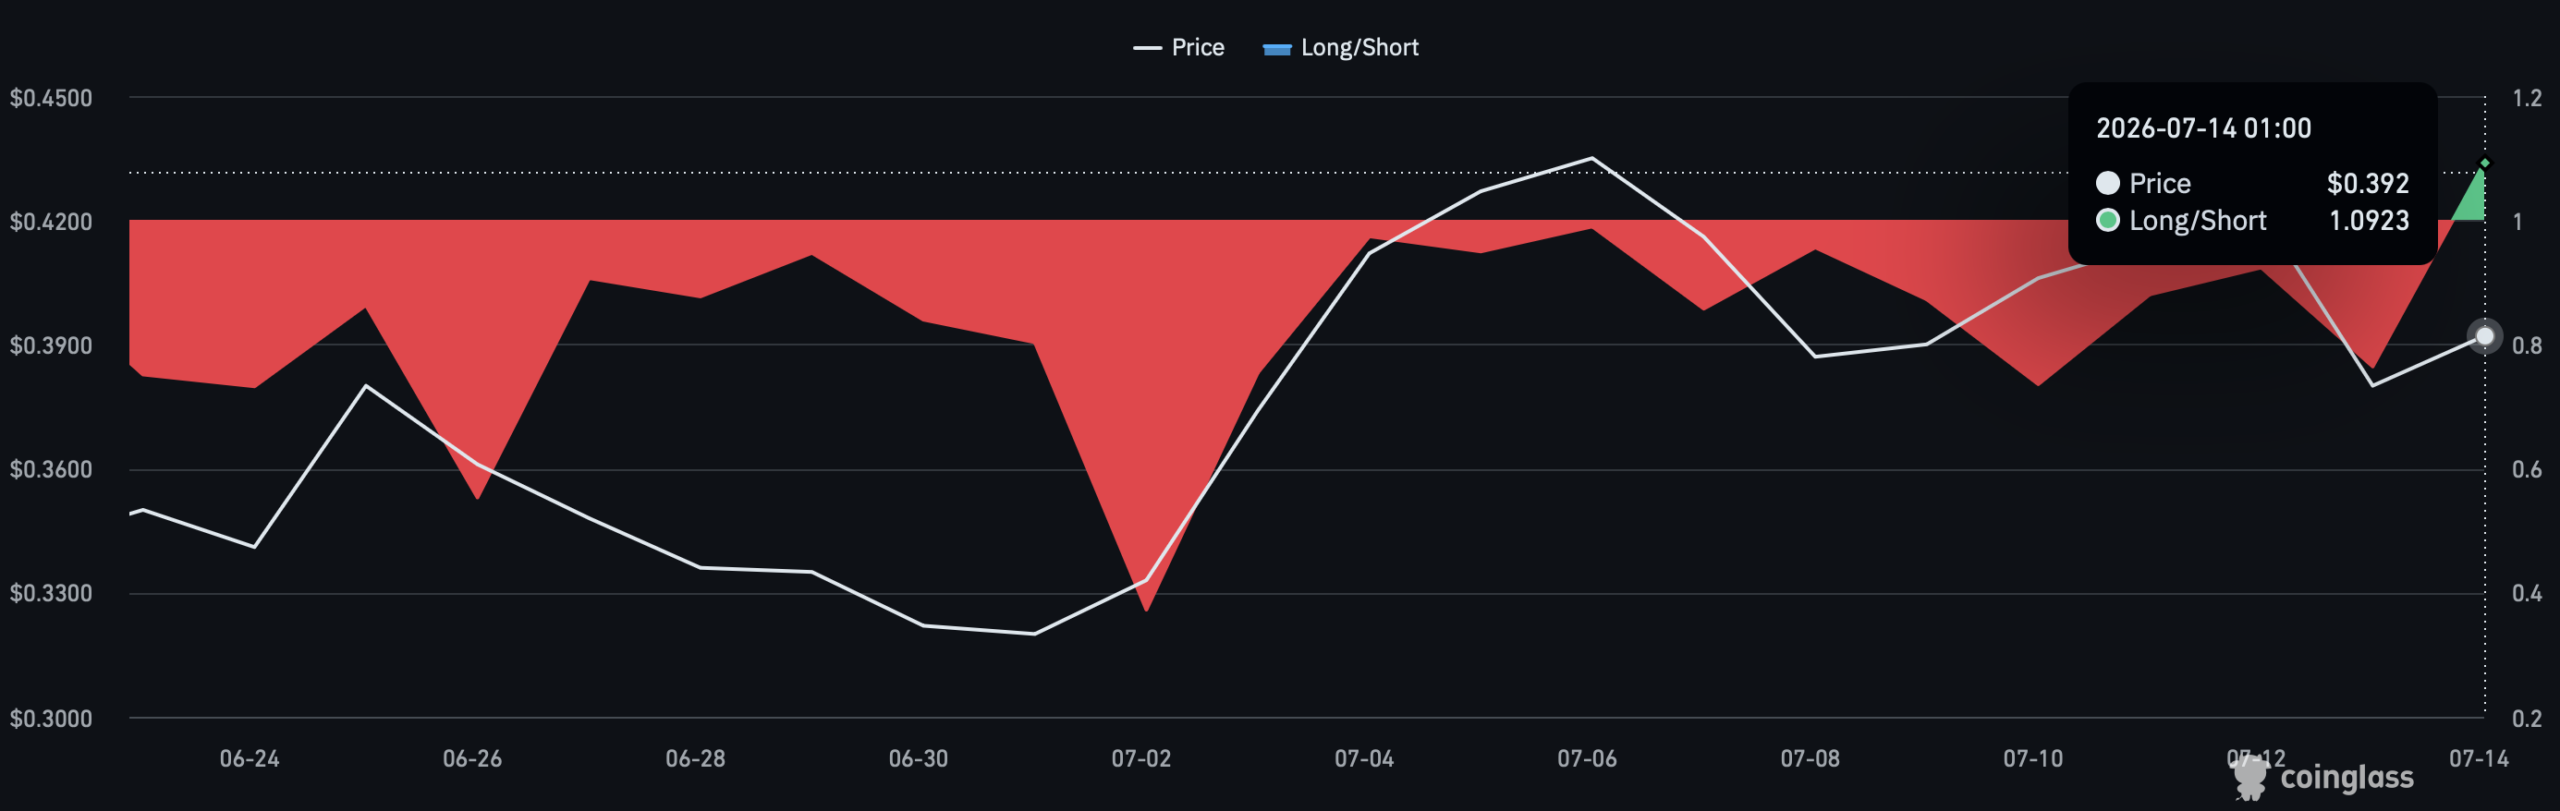
Whether this constitutes a sufficient basis for a change of direction remains to be seen. The broader crypto market that has shaped the selling sentiment has started to cool, and there remains a strong chance that ETHFI will take advantage of the reversal and recover, thus turning the momentum against the sellers.
Final summary
- Ether.fi’s token fell 10% after around $54 million left the protocol, moving in line with a broader crypto market that lost around $8.61 billion in a day.
- Buying activity is slowly resuming and a calmer market could give ETHFI room to rebound.


