




Audiera (BEAT) climbed 18.81% over the past 24 hours to trade around $2.70, while daily trading volume jumped 78.25%, as the market absorbed the unlocking of its tokens in early July.
The protocol released approximately 21.25 million BEAT tokens between July 1 and 3, representing 2.13% of the total supply and 7.3% of the circulating supply.
Such events often weigh on prices as new reserves come into circulation.
However, BEAT continued to attract buyers instead of prolonging its decline. This reaction suggested that demand was absorbing the newly available supply. Investors have also turned to tokenomics focused on Audiera’s products.
Revenue generated on the platform continued to support a dynamic burning mechanism that permanently removed tokens from circulation.
As a result, the deflationary structure appeared to offset some of the supply impact of the release, helping to stabilize market sentiment following the distribution event.
Why do the best traders always support BEAT?
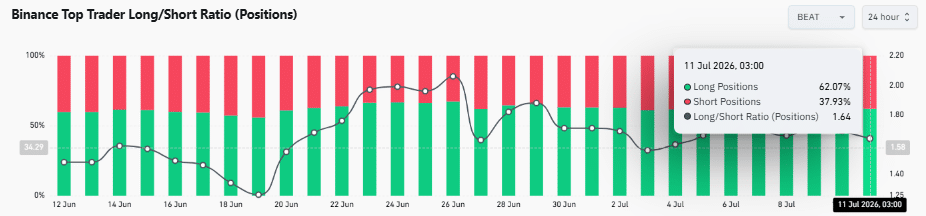
Bullish conviction remained evident at Binance despite BEAT’s recent rally.
Data from CoinGlass showed that 62.07% of top traders’ positions remained long, while short positions accounted for 37.93%.
This distribution resulted in a Long/Short ratio of 1.64, highlighting that experienced participants continued to favor higher prices rather than preparing for a reversal.
This positioning reflects confidence even after the token appreciated by almost 19% in the previous 24 hours.
However, this imbalance has also increased the importance of holding support, as crowded long positioning can amplify volatility whenever sentiment changes.
Despite this, buyers continued to control the broader positioning landscape, indicating that traders viewed the recent rally as more than a temporary reaction to the completed unlock event.
BEAT calls for support as buyers take back control
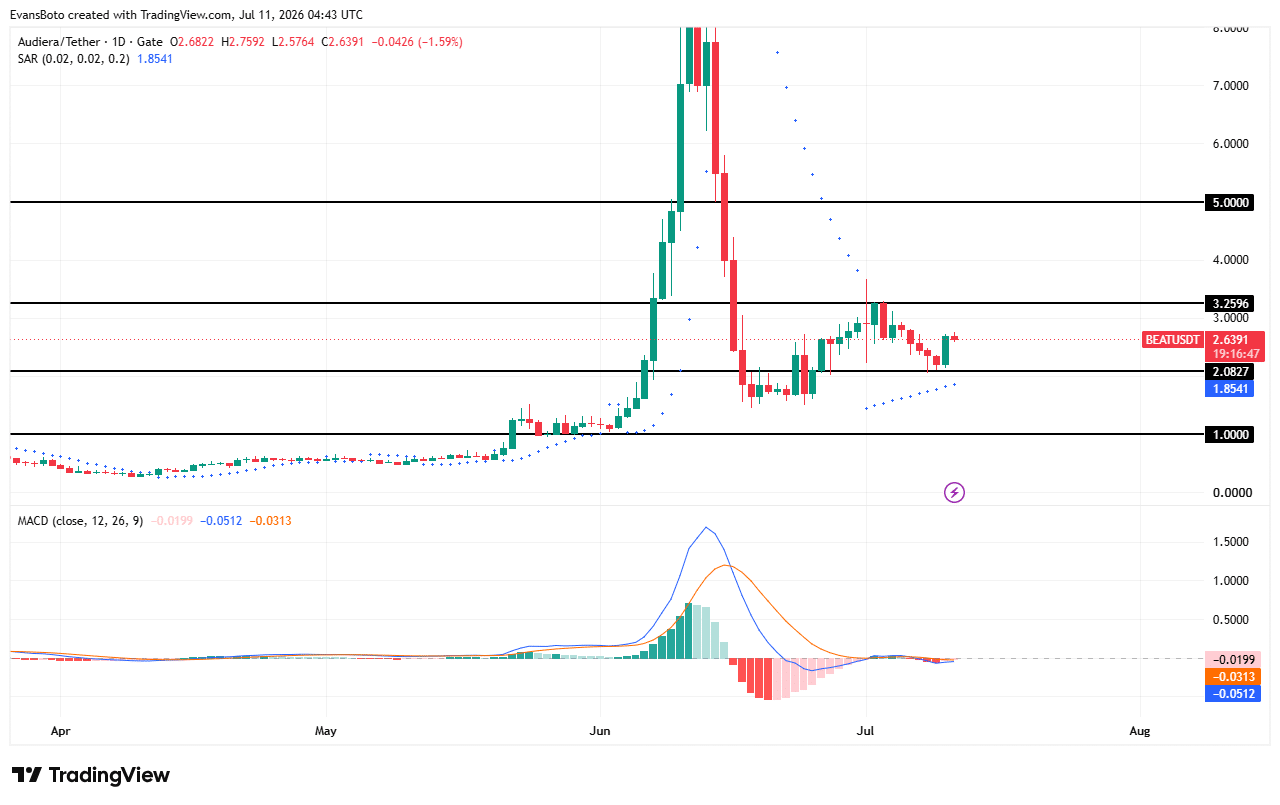
BEAT recovered from the $2.08 support zone and traded near $2.64 after buyers defended lower levels during the recent pullback.
The Parabolic SAR moved below price, indicating that control of the short-term trend had returned to the bulls after several sessions of weakness.
However, the Moving Average Convergence Divergence (MACD) paints a more conservative picture.
The MACD line remained below the signal line, while the histogram remained slightly negative despite signs of stabilization.
This combination suggests that the bearish pressure has eased but not completely disappeared.
The price also remained below the important resistance at $3.26, leaving another hurdle before a broader rally can develop.
If buyers maintain control above $2.08, BEAT could challenge higher resistance levels. Otherwise, weakening demand could encourage a further test of recently defended support.
Where could the next volatility arise?
The liquidation heat map highlighted several liquidity groups that could influence BEAT’s next directional move.
The largest concentration of short liquidation liquidity was between approximately $2.75 and $2.85, just above the current trading range.
This area could attract prices if buyers continue to push higher, as liquidated shorts often accelerate moves higher.
Below the market, another notable liquidity cluster formed between $2.45 and $2.50. A decline to this area could trigger long sell-offs and increase selling pressure over a short period of time.
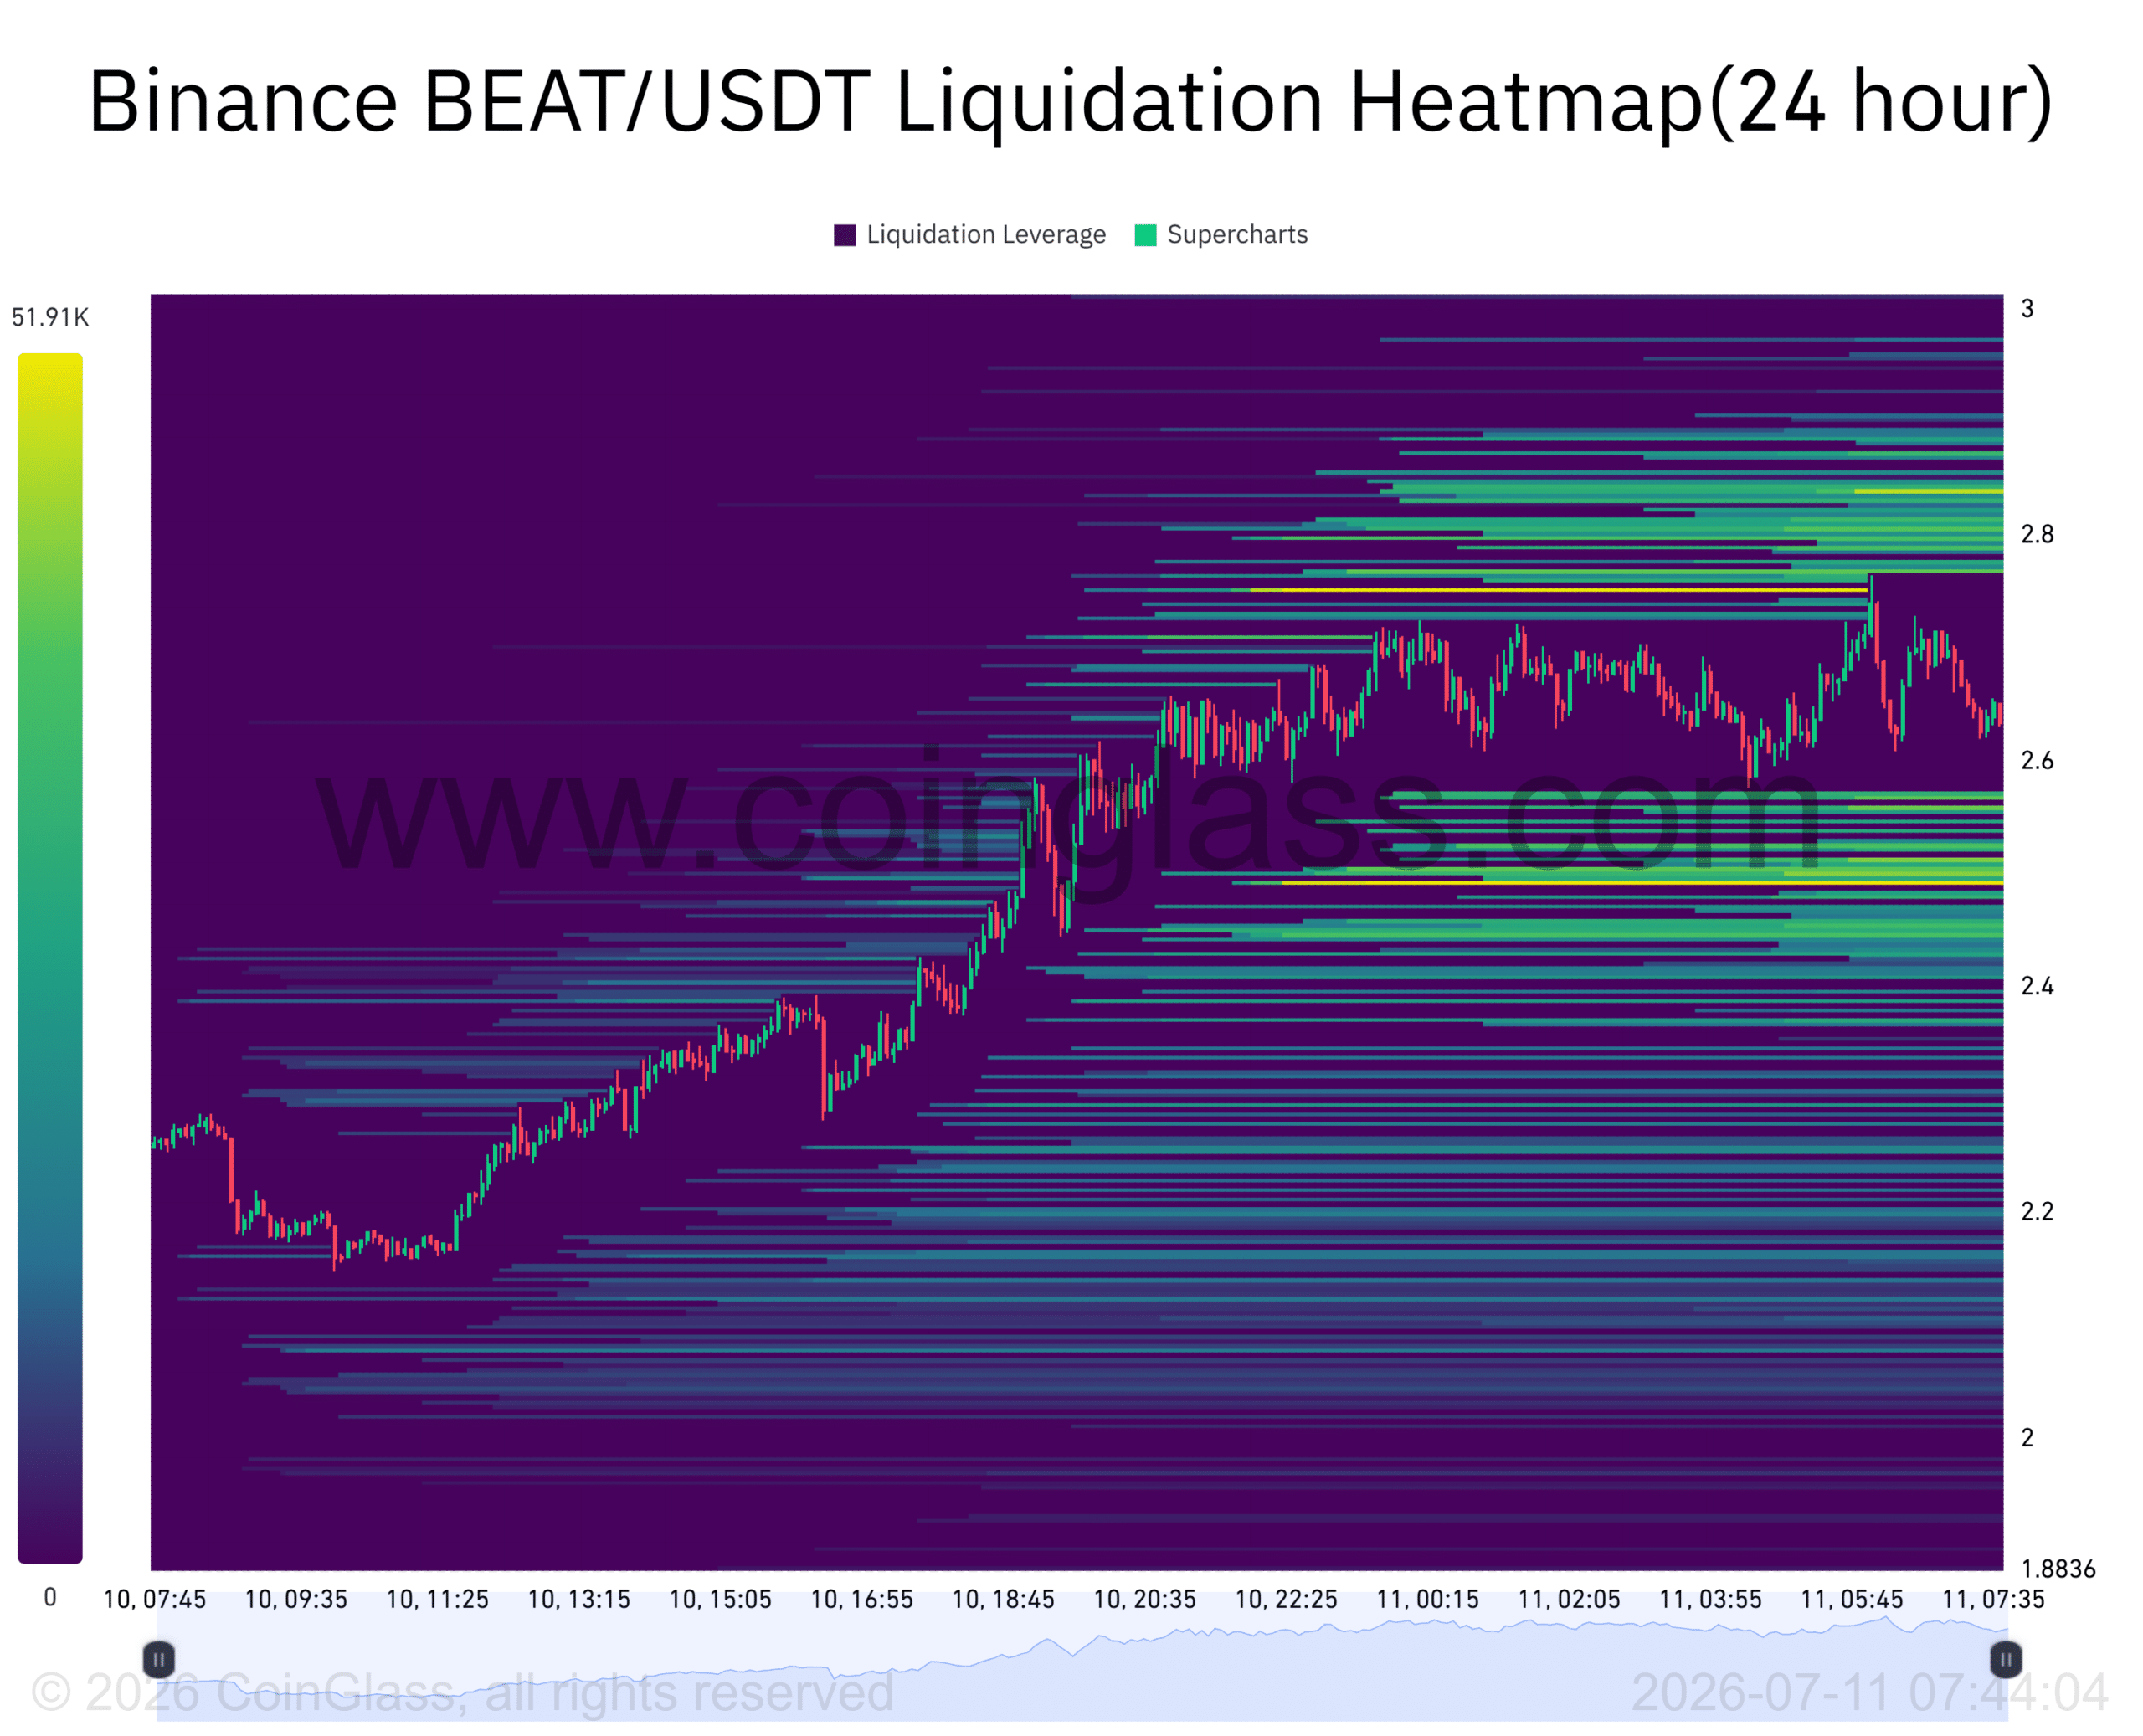
The current positioning therefore places BEAT between two pockets of significant liquidity.
Whichever cluster price reaches first would likely determine the next wave of volatility as leveraged positions unwind on either side of the market.
Final Summary
- BEAT absorbed the symbolic July unlock while strong demand kept buyers in control.
- Bullish trader positioning and nearby liquidity are now shaping BEAT’s next potential price move.


