




BNB fell almost 5% as uncertainty surrounding Binance’s European regulatory status collides with a risk-averse trend in crypto markets ahead of the EU MiCA implementation deadline.
Summary
- BNB fell almost 5% as uncertainty around Binance’s approval of MiCA weighed on sentiment.
- Spot Bitcoin and Ethereum ETFs saw further outflows as traders adjusted to the Fed’s hawkish outlook.
- Technical indicators place key support between $582 and $585, with a breakout likely to move towards $556.
According to data from crypto.news, Binance Coin (BNB) fell to around $576 on June 18 after reports suggested that Binance’s path to a Crypto Asset Markets License (MICA) remains unresolved, less than two weeks before the European Union’s July 1 compliance deadline.
The decline unfolded alongside a broader sell-off in cryptocurrencies that sent the total market capitalization down nearly 3% to $2.18 trillion, while Bitcoin fell below $63,000 following a hawkish outlook from the Federal Reserve.
The regulatory environment has become a new source of concern for BNB holders. According to a report from The Big Whale, European Central Bank President Christine Lagarde has opposed Binance’s entry into the EU market, raising questions about whether the exchange can obtain authorization before the transition period expires.
Without MiCA approval, exchanges could be forced to discontinue services for EU clients or withdraw from certain jurisdictions.
Meanwhile, institutional demand in the crypto market has weakened. Data from SoSoValue showed that Bitcoin spot ETFs in the United States saw net outflows of $82.16 million, while Ethereum spot ETFs lost another $29.37 million. The withdrawals came as traders reevaluated their interest rate expectations after Federal Reserve officials planned fewer rate cuts and left the door open for tighter policy if inflation remained high.
Oil markets have provided little relief. Although crude prices have retreated from recent highs following developments in U.S.-Iran negotiations, investors continue to weigh the risk that geopolitical tensions could resurface and complicate the inflation outlook.
Higher and longer rates have historically weighed on speculative assets, including exchange-linked tokens such as BNB.
BNB technical structure remains focused on the key $585 support zone
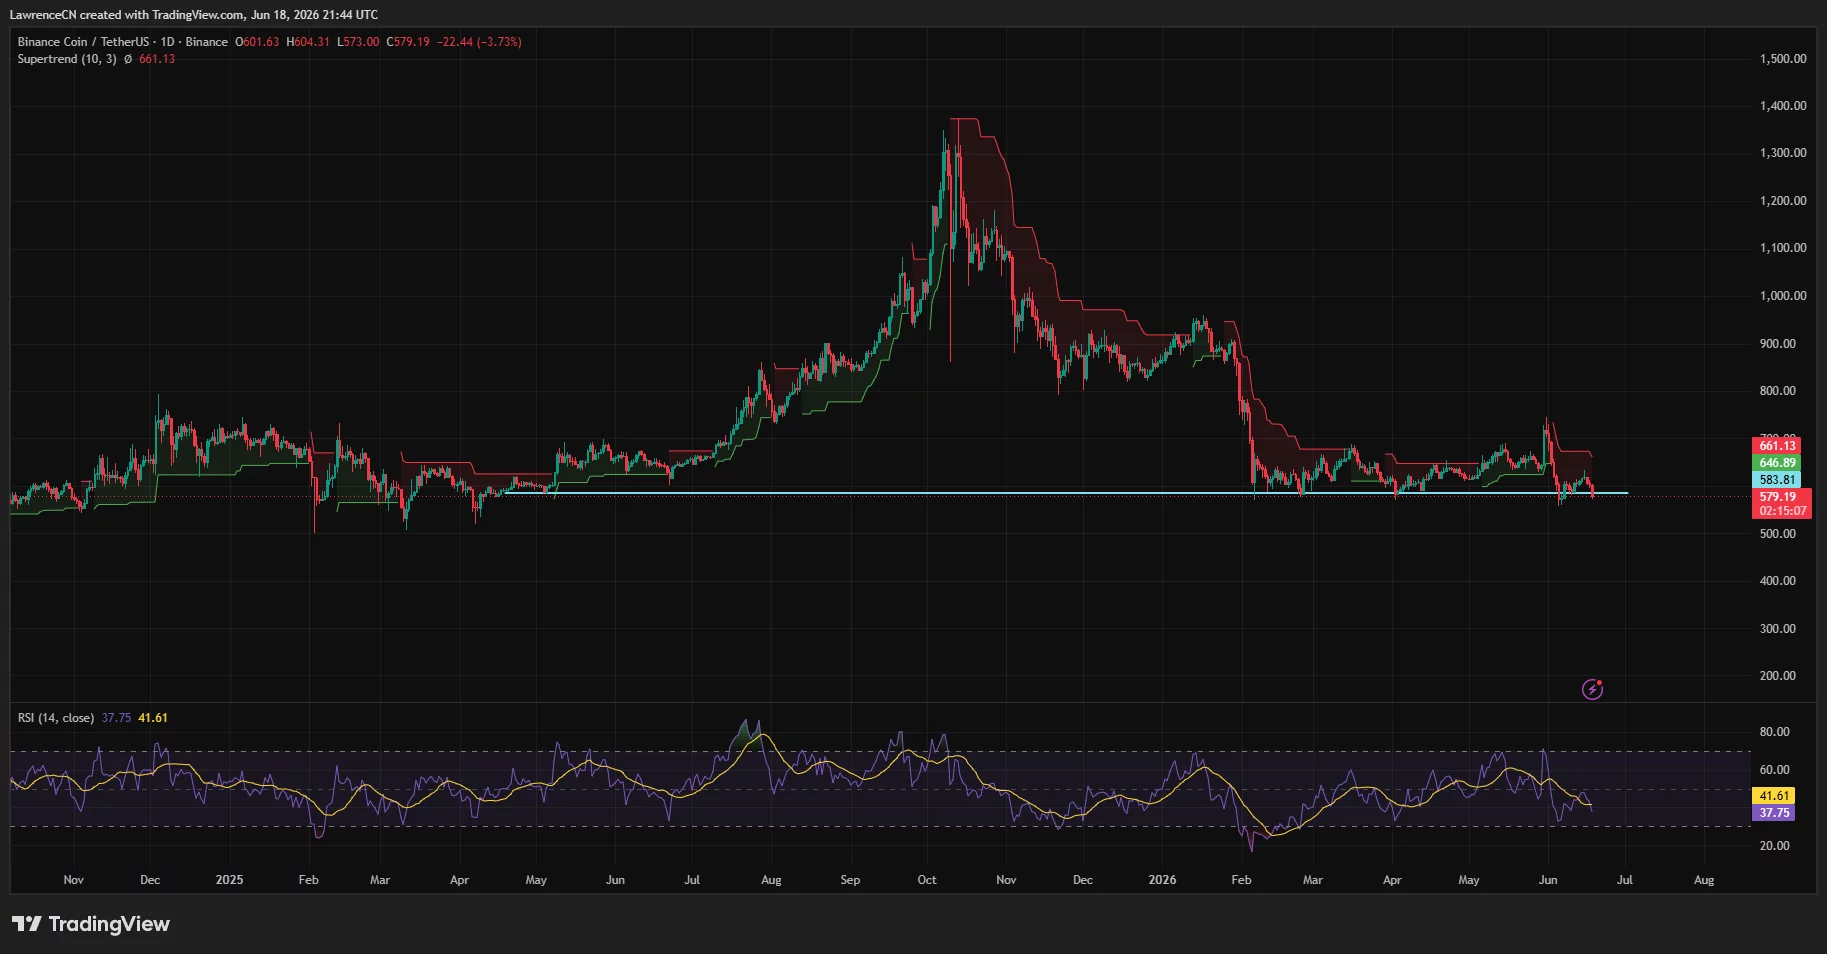
The daily chart shows BNB trading below its Supertrend resistance near $661, after failing to regain momentum during several recovery attempts since February. BNB price remains stuck near the lower end of its multi-month range, while the daily RSI has fallen to around 38, its lowest value since early April, highlighting continued selling pressure.
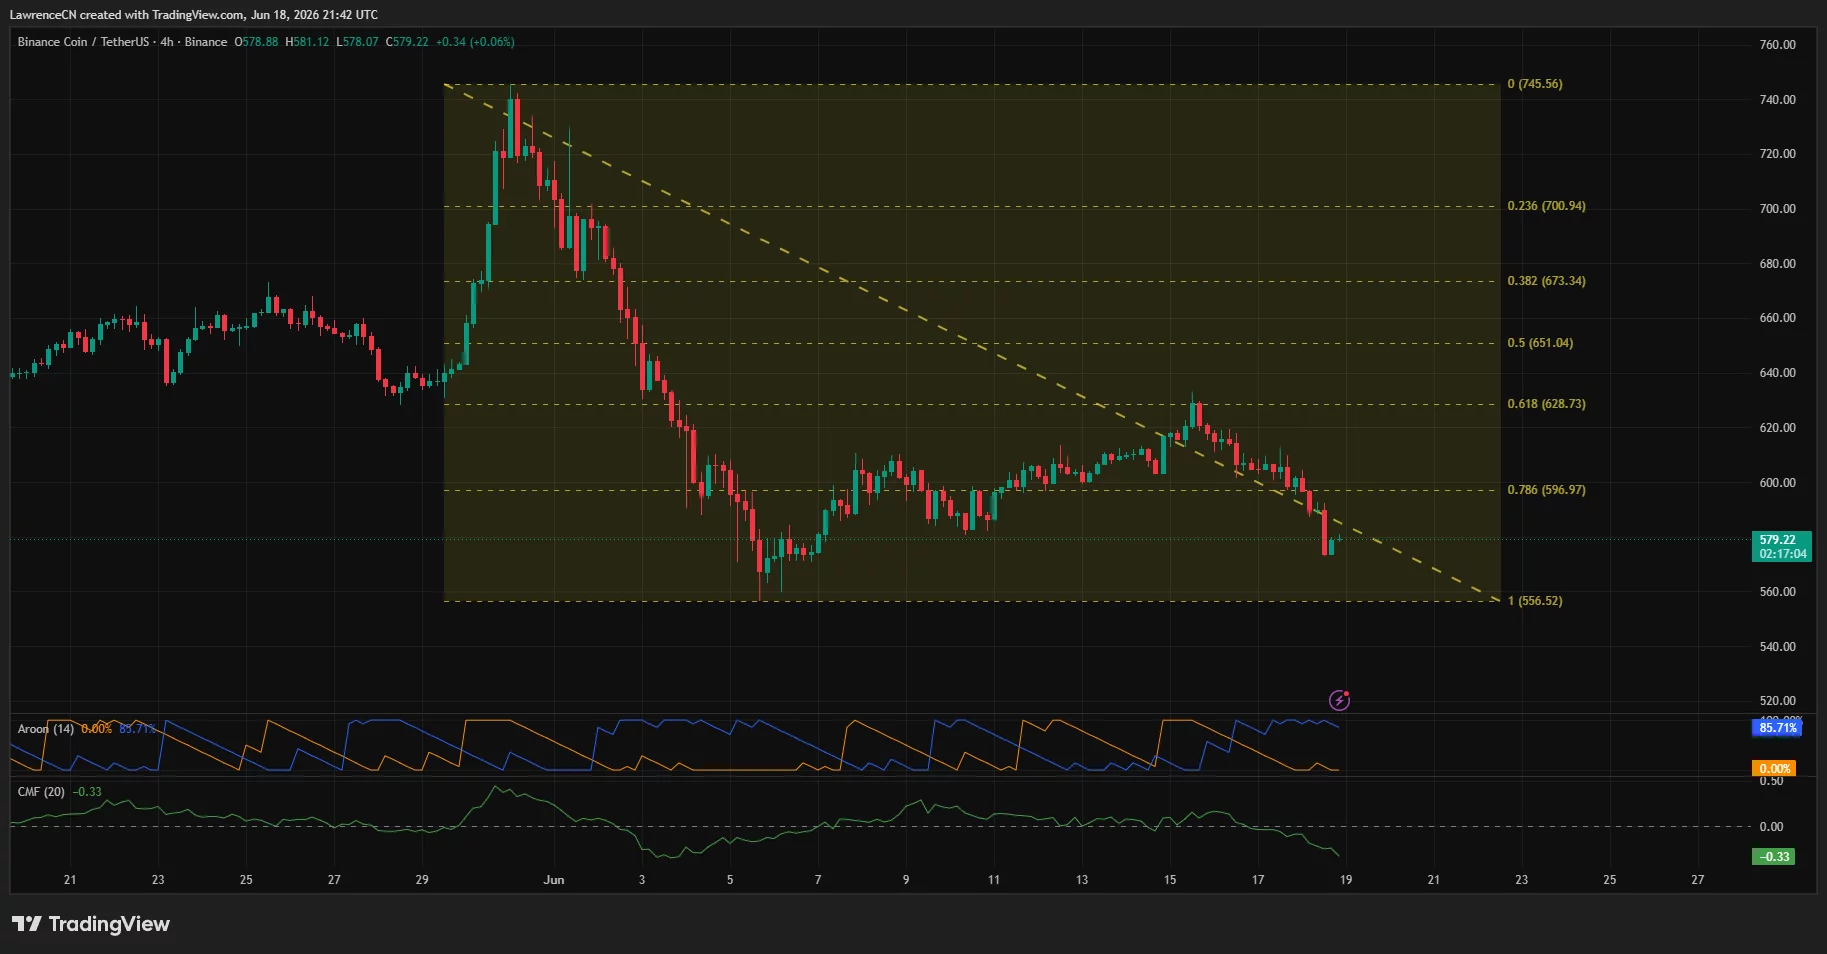
On the four-hour chart, BNB recently fell below a descending trendline that connected lower highs since late May. The sell-off pushed the token towards the 100% Fibonacci retracement level near $556, calculated from the late May rally that peaked around $745. Immediate resistance now lies near the 0.786 retracement at $597, followed by stronger supply zones around $629 and $651.
According to analyst Umair Orazkay, the $585-$600 region remains the most important area for bulls to defend.
“The number is psychological and is roughly in the same area where the bottom of the range is, so it is very important to defend the $585-$600 area for BNB, as a few closes below this value can trigger panic selling.”
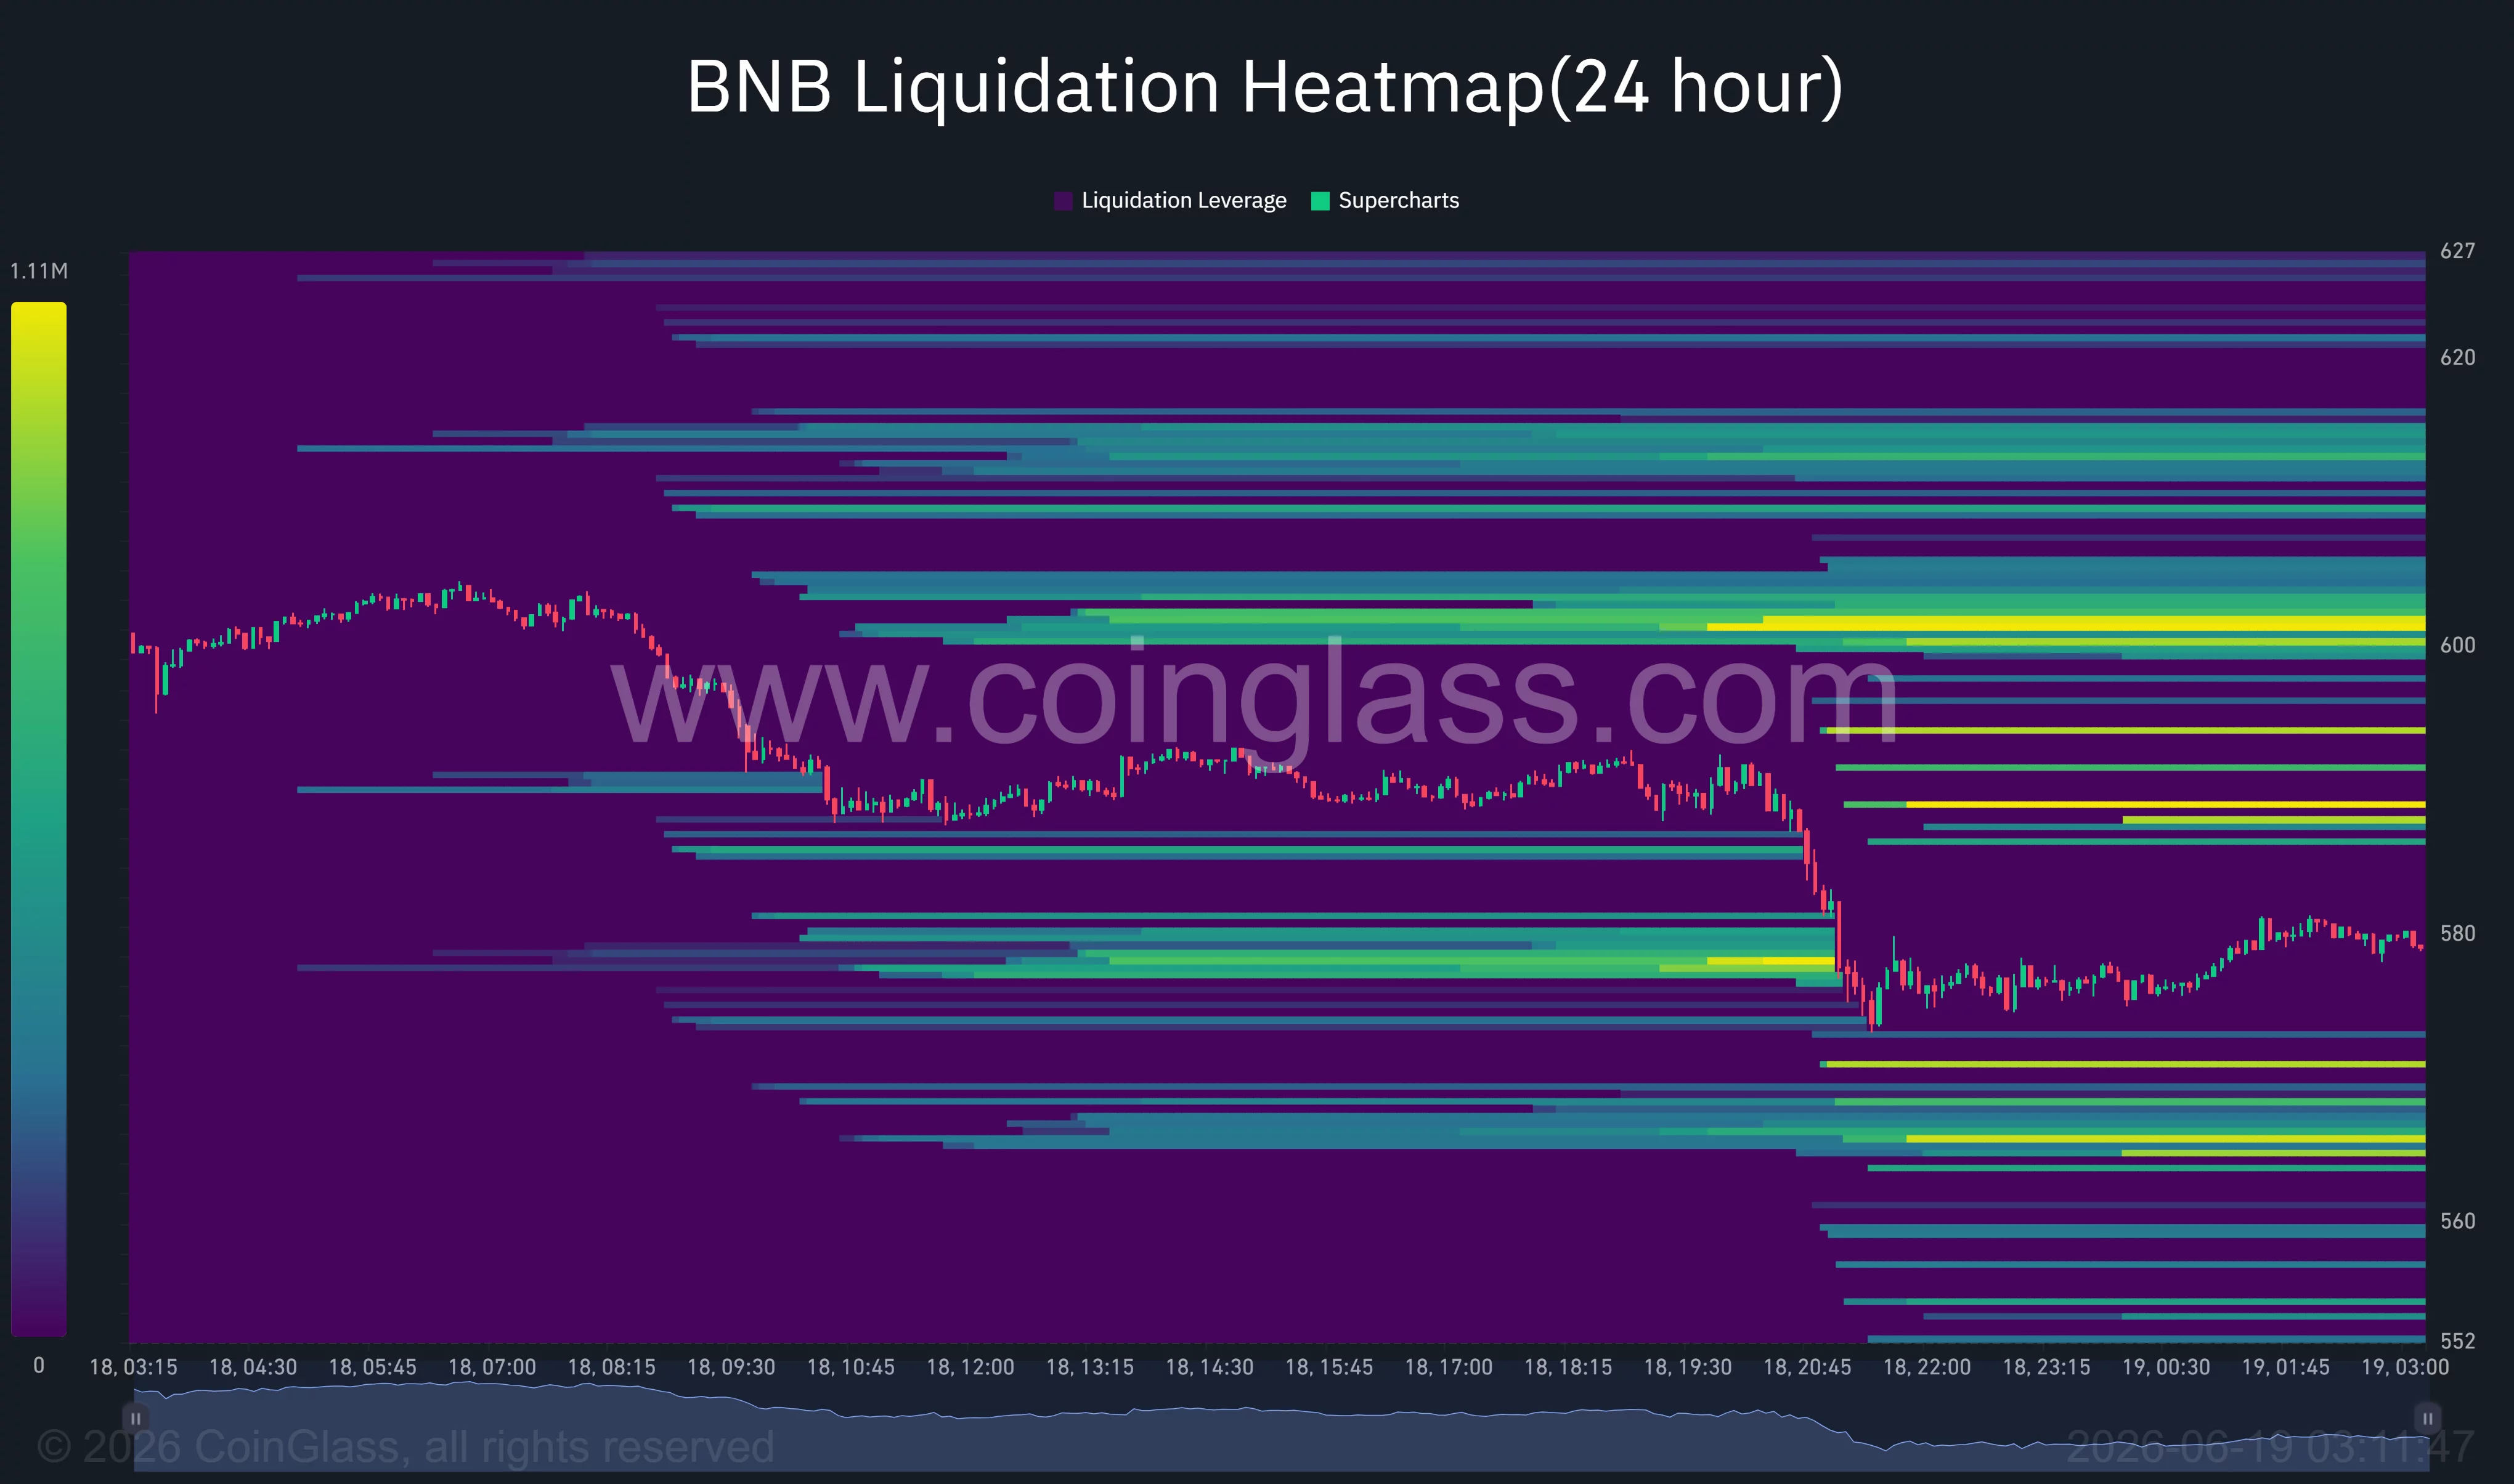
Liquidity data suggests traders are closely watching the same levels. Liquidation heatmaps from CoinGlass show one of the largest nearby leverage clusters concentrated around the $600 mark, with additional short liquidations stacked between $620 and $627. A recovery in these areas could trigger a squeeze, while continued weakness could attract further downward volatility.
A break below demand support could expose pockets of weaker liquidity
Another group of traders remains focused on an area of demand slightly below current prices. Commenting on the recent structure, crypto analyst Mr. Bullish argued that BNB started to form higher highs and lower lows after the June bounce and identified the $582 to $585 region as a critical support zone for buyers.
The bullish thesis weakens significantly if this demand zone fails. A decisive move below $582 would put the June low and Fibonacci support near $556 back into focus.
Below this level, liquidation heatmaps show relatively thinner liquidity up to the mid-$550 area, increasing the risk of a deeper decline if sellers regain control.
Disclosure: This article does not represent investment advice. The content and materials presented on this page are intended for educational purposes only.


