




View original TradingView chart
TL;DR
- TradingView analyst Fibsrus says Bitcoin could form an inverted head-and-shoulders pattern.
- The projected target is around $69,000 if BTC breaks out and closes above the neckline.
- The pattern is invalidated if Bitcoin breaks below the right shoulder low near $59,400.
Bitcoin Chart Shows Potential Bullish Reversal
A TradingView analyst has highlighted a possible inverse head-and-shoulders pattern on the Bitcoin daily chart, with a projected target near $69,000 if the pattern holds true.
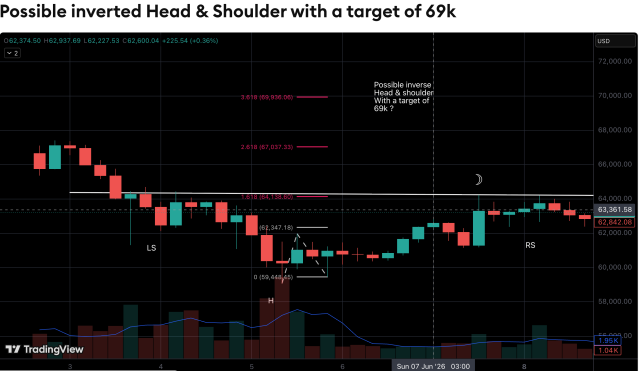
The idea, posted by TradingView user fibsrus, identifies a left shoulder, head, and right shoulder structure on BTC/USD. In classic technical analysis, an inverse head-and-shoulders pattern is treated as a potential bullish reversal pattern, but only after price breakouts and a close above the neck line.
This confirmation point is important. Until Bitcoin clears the neckline resistance, the pattern remains a setup rather than a completed signal.
Key Levels Traders Watch
The analyst’s projected upside target is around $69,000, based on measured movement versus trend. This level would represent a significant recovery target if buyers can push Bitcoin above the neckline and maintain momentum.
Equally important is the level of invalidation. The setup notes the right shoulder low around $59,400. A break below this area would weaken or invalidate the bullish structure, as it would suggest that buyers have failed to defend the area needed to complete the reversal.
This gives traders a relatively clear framework: the bullish case depends on a neckline breakout and a daily close, while the bearish or invalidation case strengthens if Bitcoin loses the right shoulder support zone.
Why this pattern requires caution
Chart models are useful because they help traders define risk and structure, but they are not guarantees. Inverted head-and-shoulders patterns can fail, especially when volume is low or overall market sentiment is declining.
Fake rashes are also common. Bitcoin can briefly rise above a neckline, attract momentum buyers, and then reverse sharply if there isn’t enough follow through. This is why many traders wait for a confirmed daily close and, in some cases, a successful retest of the neckline before considering the move active.
For now, it’s best to read TradingView’s idea as a clear analyst framework rather than a prediction. The target of $69,000 is conditional and the invalidation zone of $59,400 remains the level that would challenge the bullish structure.
Source/Media note
Requested screenshot: TradingView chart with left shoulder, head, right shoulder and neckline visible.
This analysis is based on a TradingView idea from analyst fibsrus.
The broader market context is also important. A bullish chart pattern has a better chance of coming to fruition when liquidity, risk appetite, and momentum are aligned. If macroeconomic conditions weaken or crypto market scale deteriorates, even a clear-looking technical model may struggle to achieve its measured goal. This is why cleavage and invalidation levels are more useful than the target alone.
For now, the clearest reading is that Bitcoin is between a defined bullish trigger and a defined invalidation zone. This makes the setup useful even for traders who disagree with the objective, because it indicates where the idea is likely to work and where it is probably wrong.
Editorial process as Bitcoinist focuses on providing thoroughly researched, accurate and unbiased content. We follow strict sourcing standards and every page undergoes careful review by our team of top technology experts and seasoned editors. This process ensures the integrity, relevance and value of our content to our readers.


