




Close Menu
Altcoin ObserverAltcoin Observer
  • Regulation
  • Bitcoin
  • Altcoins
  • Market
  • Analysis
  • DeFi
  • Security
  • Ethereum
Categories
  • Altcoins (3,717)
  • Analysis (3,826)
  • Bitcoin (4,455)
  • Blockchain (2,157)
  • DeFi (2,623)
  • Ethereum (2,769)
  • Event (119)
  • Exclusive Deep Dive (1)
  • Landscape Ads (2)
  • Market (2,714)
  • Press Releases (12)
  • Reddit (2,847)
  • Regulation (2,474)
  • Security (4,089)
  • Thought Leadership (3)
  • Videos (44)
Hand picked
  • How tokenized cows are revolutionizing agricultural finance in Brazil – Bitcoin News
  • Audiera – THIS breakout could send BEAT to $4 ONLY IF…
  • Has institutional trust returned to crypto?
  • TRON Network Releases Mandatory GreatVoyage v4.8.2 Update
  • Tesla’s $112M Bitcoin Depreciation Didn’t Move a Single Coin in Q2 2026
We are social
  • Facebook
  • Twitter
  • Instagram
  • YouTube
Facebook X (Twitter) Instagram
  • About us
  • Disclaimer
  • Terms of service
  • Privacy policy
  • Contact us
Facebook X (Twitter) Instagram YouTube LinkedIn
Altcoin ObserverAltcoin Observer
  • Regulation
  • Bitcoin
  • Altcoins
  • Market
  • Analysis
  • DeFi
  • Security
  • Ethereum
Events
Altcoin ObserverAltcoin Observer
Home»Analysis»Bitcoin eyes $80,000 average as Peter Brandt signals ‘horn’ pattern
Analysis

Bitcoin eyes $80,000 average as Peter Brandt signals ‘horn’ pattern

March 16, 2026No Comments
Share Facebook Twitter Pinterest LinkedIn Tumblr Reddit Telegram Email
Share
Facebook Twitter LinkedIn Pinterest Email


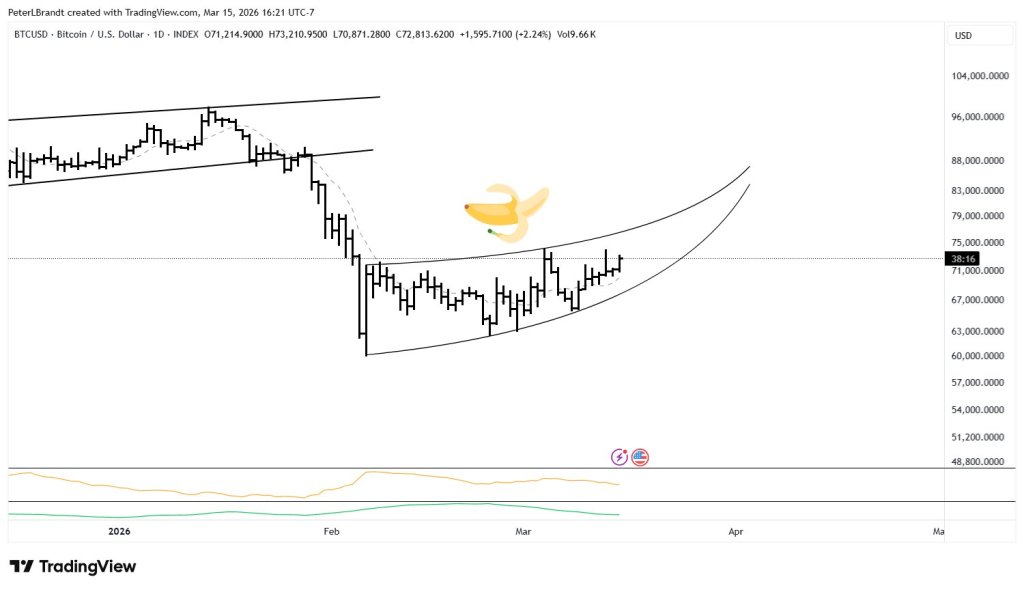
Veteran trader Peter Brandt sparked a new round of debate around Bitcoin after posting a chart and writing: “The banana splits. This is a horn. Richard W. Schabacker wrote about this in his 1934 book.” For market participants accustomed to Brandt’s shorthand, the message indicated a possible shift in how he interprets BTC’s recent rally structure.

The chart shared by Brandt shows that Bitcoin, on the daily time frame, rebounded from a strong February washout to $60,000 and was climbing back towards $70,000. Published candle data showed BTC closing at $72,813.62 on the day, with an intraday high of $73,210.95. Around this bounce, Brandt drew two increasingly wider curved boundaries, creating the outline of what he called a “horn.”
Bitcoin Price Analysis
Bitcoin Price Analysis | Source: X @PeterLBrandt

“Banana/Horn” could send $80,000 worth of Bitcoin

What makes this article confusing is that “banana” is not a standard textbook label in the same way that a flag, a wedge, or a triangle are. In context, Brandt appears to be using it descriptively: the recovery arc appears rounded and elongated, and his comment that “the banana splits” suggests that the smooth curve is beginning to open outward into a wider, more unstable formation. This is where the “horn” reference comes in.

Related reading

In classic charting parlance, a horn pattern is best understood as an expanding structure, in which the price trajectory is not tightening but extending. Brandt’s reference to Richard W. Schabacker is important because Schabacker’s prewar technical analysis work lies close to the foundations of modern classical cartography. Invoking a 1934 text, Brandt presented the configuration as old-fashioned graphic geometry rather than a crypto-native meme or one-off joke.

The problem is that Brandt himself did not present the model as established. When one user replied, “Dude, pick one. Horn or flag,” Brandt responded, “Can be either. Sorry you can’t handle the flexibility.” This response is important. This suggests that he is not yet making a categorical choice between a more conventional continuation flag and an expanded cornet-type formation. Instead, he seems to emphasize that structure is in transition and that real-time pattern recognition is rarely as clear as retrospective textbook examples.

Related reading

Read this way, the tweet is less of an accurate forecast than a warning about the character of the market. A flag would generally imply a more orderly break in the trend. A horn, on the other hand, involves wider oscillations and less controlled advance. On the Brandt chart, Bitcoin crosses the upper half of the formation, but the plotted boundaries extend outward as the price moves to the right, visually supporting the idea that volatility could be increasing rather than compressing.

As for the price target, Brandt has not annotated a measured move, so any projections should be treated as approximate. The most reasonable reading of the image is not a fixed break target but a path target along the horn itself. The upper curved boundary rises from around $70,000 in mid-March to around $83,000 to $88,000 in early April, while the lower boundary also tends to rise sharply. If Bitcoin continues to follow the upper part of the pattern, the chart appears to be pointing towards the low to mid $80,000 levels as the next visible area.

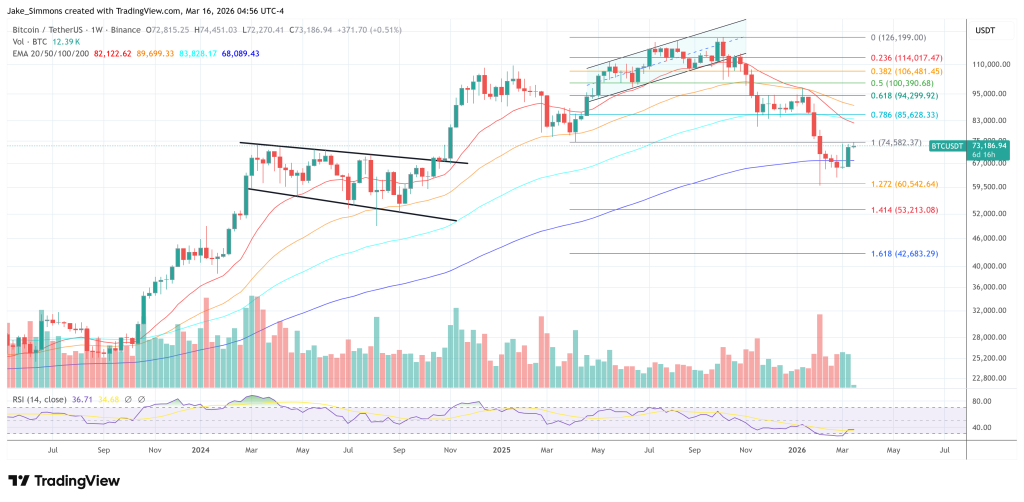
At press time, BTC was trading at $73,186.
Bitcoin Price Chart
Bitcoin must surpass $74,500, 1-week chart | Source: BTCUSDT on TradingView.com

Featured image created with DALL.E, chart from TradingView.com


Source link

Share. Facebook Twitter Pinterest LinkedIn Tumblr Email
Previous ArticleBitMart Officially Launches Prediction Market, Supporting Trading of Crypto Predictions and Popular Events
Next Article Mapping Ethereum Macro Sensitivity – Oil, Liquidity, and Why ETH is Absorbing It All

Related Posts

Analysis

Has institutional trust returned to crypto?

July 25, 2026
Analysis

Samson Mow says SATA rebound could bring Strategy’s STRC to its level

July 25, 2026
Analysis

Cardano Technicals Screams at $0.60, But First at $0.20

July 24, 2026
Add A Comment
Leave A Reply Cancel Reply

Single Page Post
Share
  • Facebook
  • Twitter
  • Instagram
  • YouTube
Featured Content
Event

Dutch Blockchain Week 2026 strengthens position as Europe’s leading B2B blockchain event week

April 14, 2026

Amsterdam, April 2026 – Dutch Blockchain Week 2026 is rapidly evolving into one of Europe’s…

Event

Global Games Show Riyadh: The Ultimate Creator & Influencer Hub

March 31, 2026

The fast-evolving gaming ecosystem of Riyadh is powered by solid national investment, a flourishing esports…

1 2 3 … 82 Next
  • Facebook
  • Twitter
  • Instagram
  • YouTube

Audiera – THIS breakout could send BEAT to $4 ONLY IF…

July 25, 2026

AAVE Whales Return as they Approach $100 – Will Buyers Break Through?

July 25, 2026

Billions Network (BILL) Jumps 25% After Robinhood Listing – Reasons and What’s Next

July 24, 2026
Facebook X (Twitter) Instagram LinkedIn
  • About us
  • Disclaimer
  • Terms of service
  • Privacy policy
  • Contact us
© 2026 Altcoin Observer. all rights reserved by Tech Team.

Type above and press Enter to search. Press Esc to cancel.

bitcoin
Bitcoin (BTC) $ 63,944.00
ethereum
Ethereum (ETH) $ 1,854.65
tether
Tether (USDT) $ 0.999248
bnb
BNB (BNB) $ 564.69
usd-coin
USDC (USDC) $ 0.999767
xrp
XRP (XRP) $ 1.09
solana
Solana (SOL) $ 73.78
tron
TRON (TRX) $ 0.329319
figure-heloc
Figure Heloc (FIGR_HELOC) $ 1.02
staked-ether
Lido Staked Ether (STETH) $ 2,265.05