





Bitcoin is in an uncomfortable situation, and this time the warning comes from a cycle signal that has manifested itself at some of the market’s most decisive turning points.
The leading cryptocurrency has crossed a technical threshold in the weekly Gaussian uptrend that has appeared at the same stage of every previous market cycle, and according to one closely followed analyst, it could be pointing towards both. one last dive to the bottom and the last discounted entry before the next bull run.
The reversal of the Gaussian channel that matters
In a technical update released on
According to the chart below, each cycle follows a familiar sequence of a strong green expansion phase, a transition highlighted as a trend reversal, and then a red bearish channel that leads to the final sweep.
Examining Bitcoin’s multi-year logarithmic weekly chart shows that the trend is visible throughout the 2014/2015 cycle, the 2018/2019 low, and the 2022 cycle low. The current trend reversal resembles previous transitions, which places Bitcoin once again at a point where the trend has still moved into bearish territory.
According to ChartNerd, this signal has consistently appeared just before the last major downside move in past bear markets. This is why the analyst does not interpret this signal as the start of a prolonged collapse. However, this could be considered an advanced development, showing that the Bitcoin price is near a bottom.
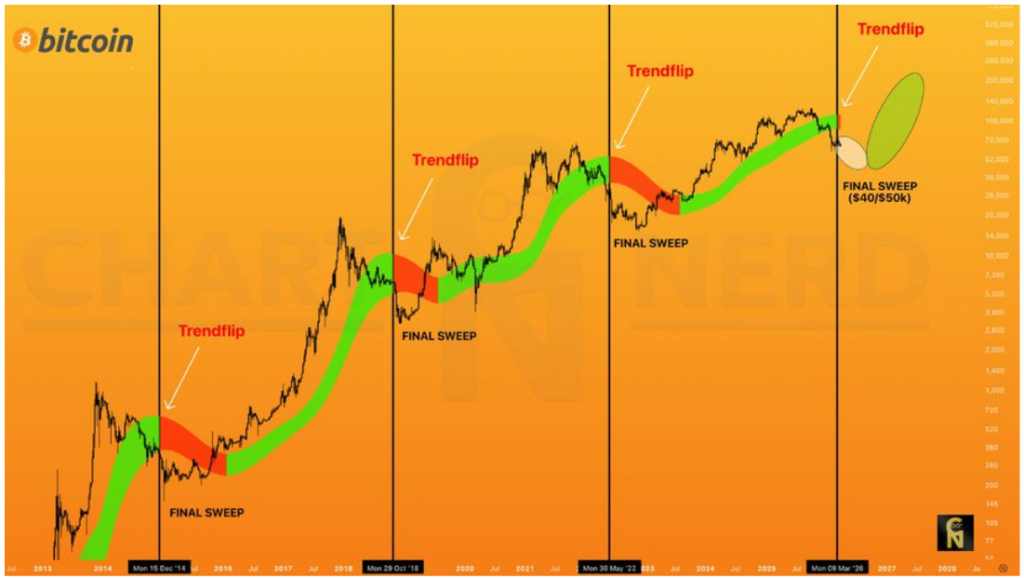
Bitcoin trend reversal. Source: @ChartNerdTA on X
The way down
Bitcoin is currently down about 47% compared to its October 2025 all-time high price of $126,080. There is still one possibility of further reduction from this point, but most of the structural damage to prices has already occurred. ChartNerd’s current reading places the final low projected somewhere in the second and third quarters of 2026, with a target range between $40,000 and $50,000.
In another analysis post, ChartNerd noted that Bitcoin’s four-year cycle structure is still intact despite recent supercycle narratives and that the current market is still operating within this structure.
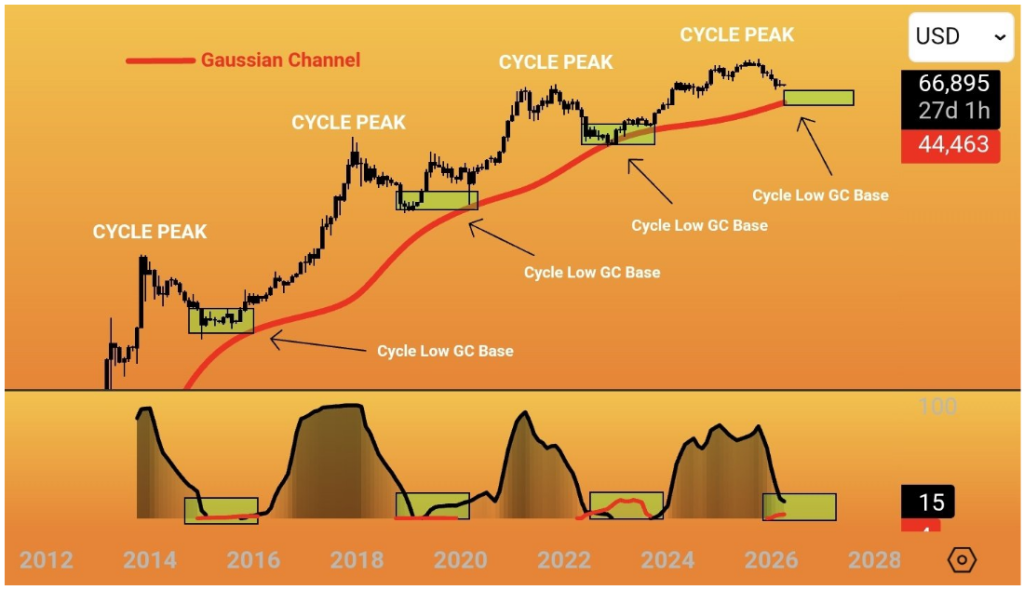
Bitcoin Gaussian Channel. Source: @ChartNerdTA on X
The Gaussian channel on the price chart shows that Bitcoin price is about to test the channel’s red baseline at $66,895 on a 27-day time frame, with the red support below at $44,463. Each previous cycle has seen a brief decline towards or below this red support line. This means that Bitcoin price could still face an additional period of downward volatility in this range before reversing upward.
Featured image from Unsplash, chart from TradingView
Editorial process as Bitcoinist focuses on providing thoroughly researched, accurate and unbiased content. We follow strict sourcing standards and every page undergoes careful review by our team of top technology experts and seasoned editors. This process ensures the integrity, relevance and value of our content to our readers.


