




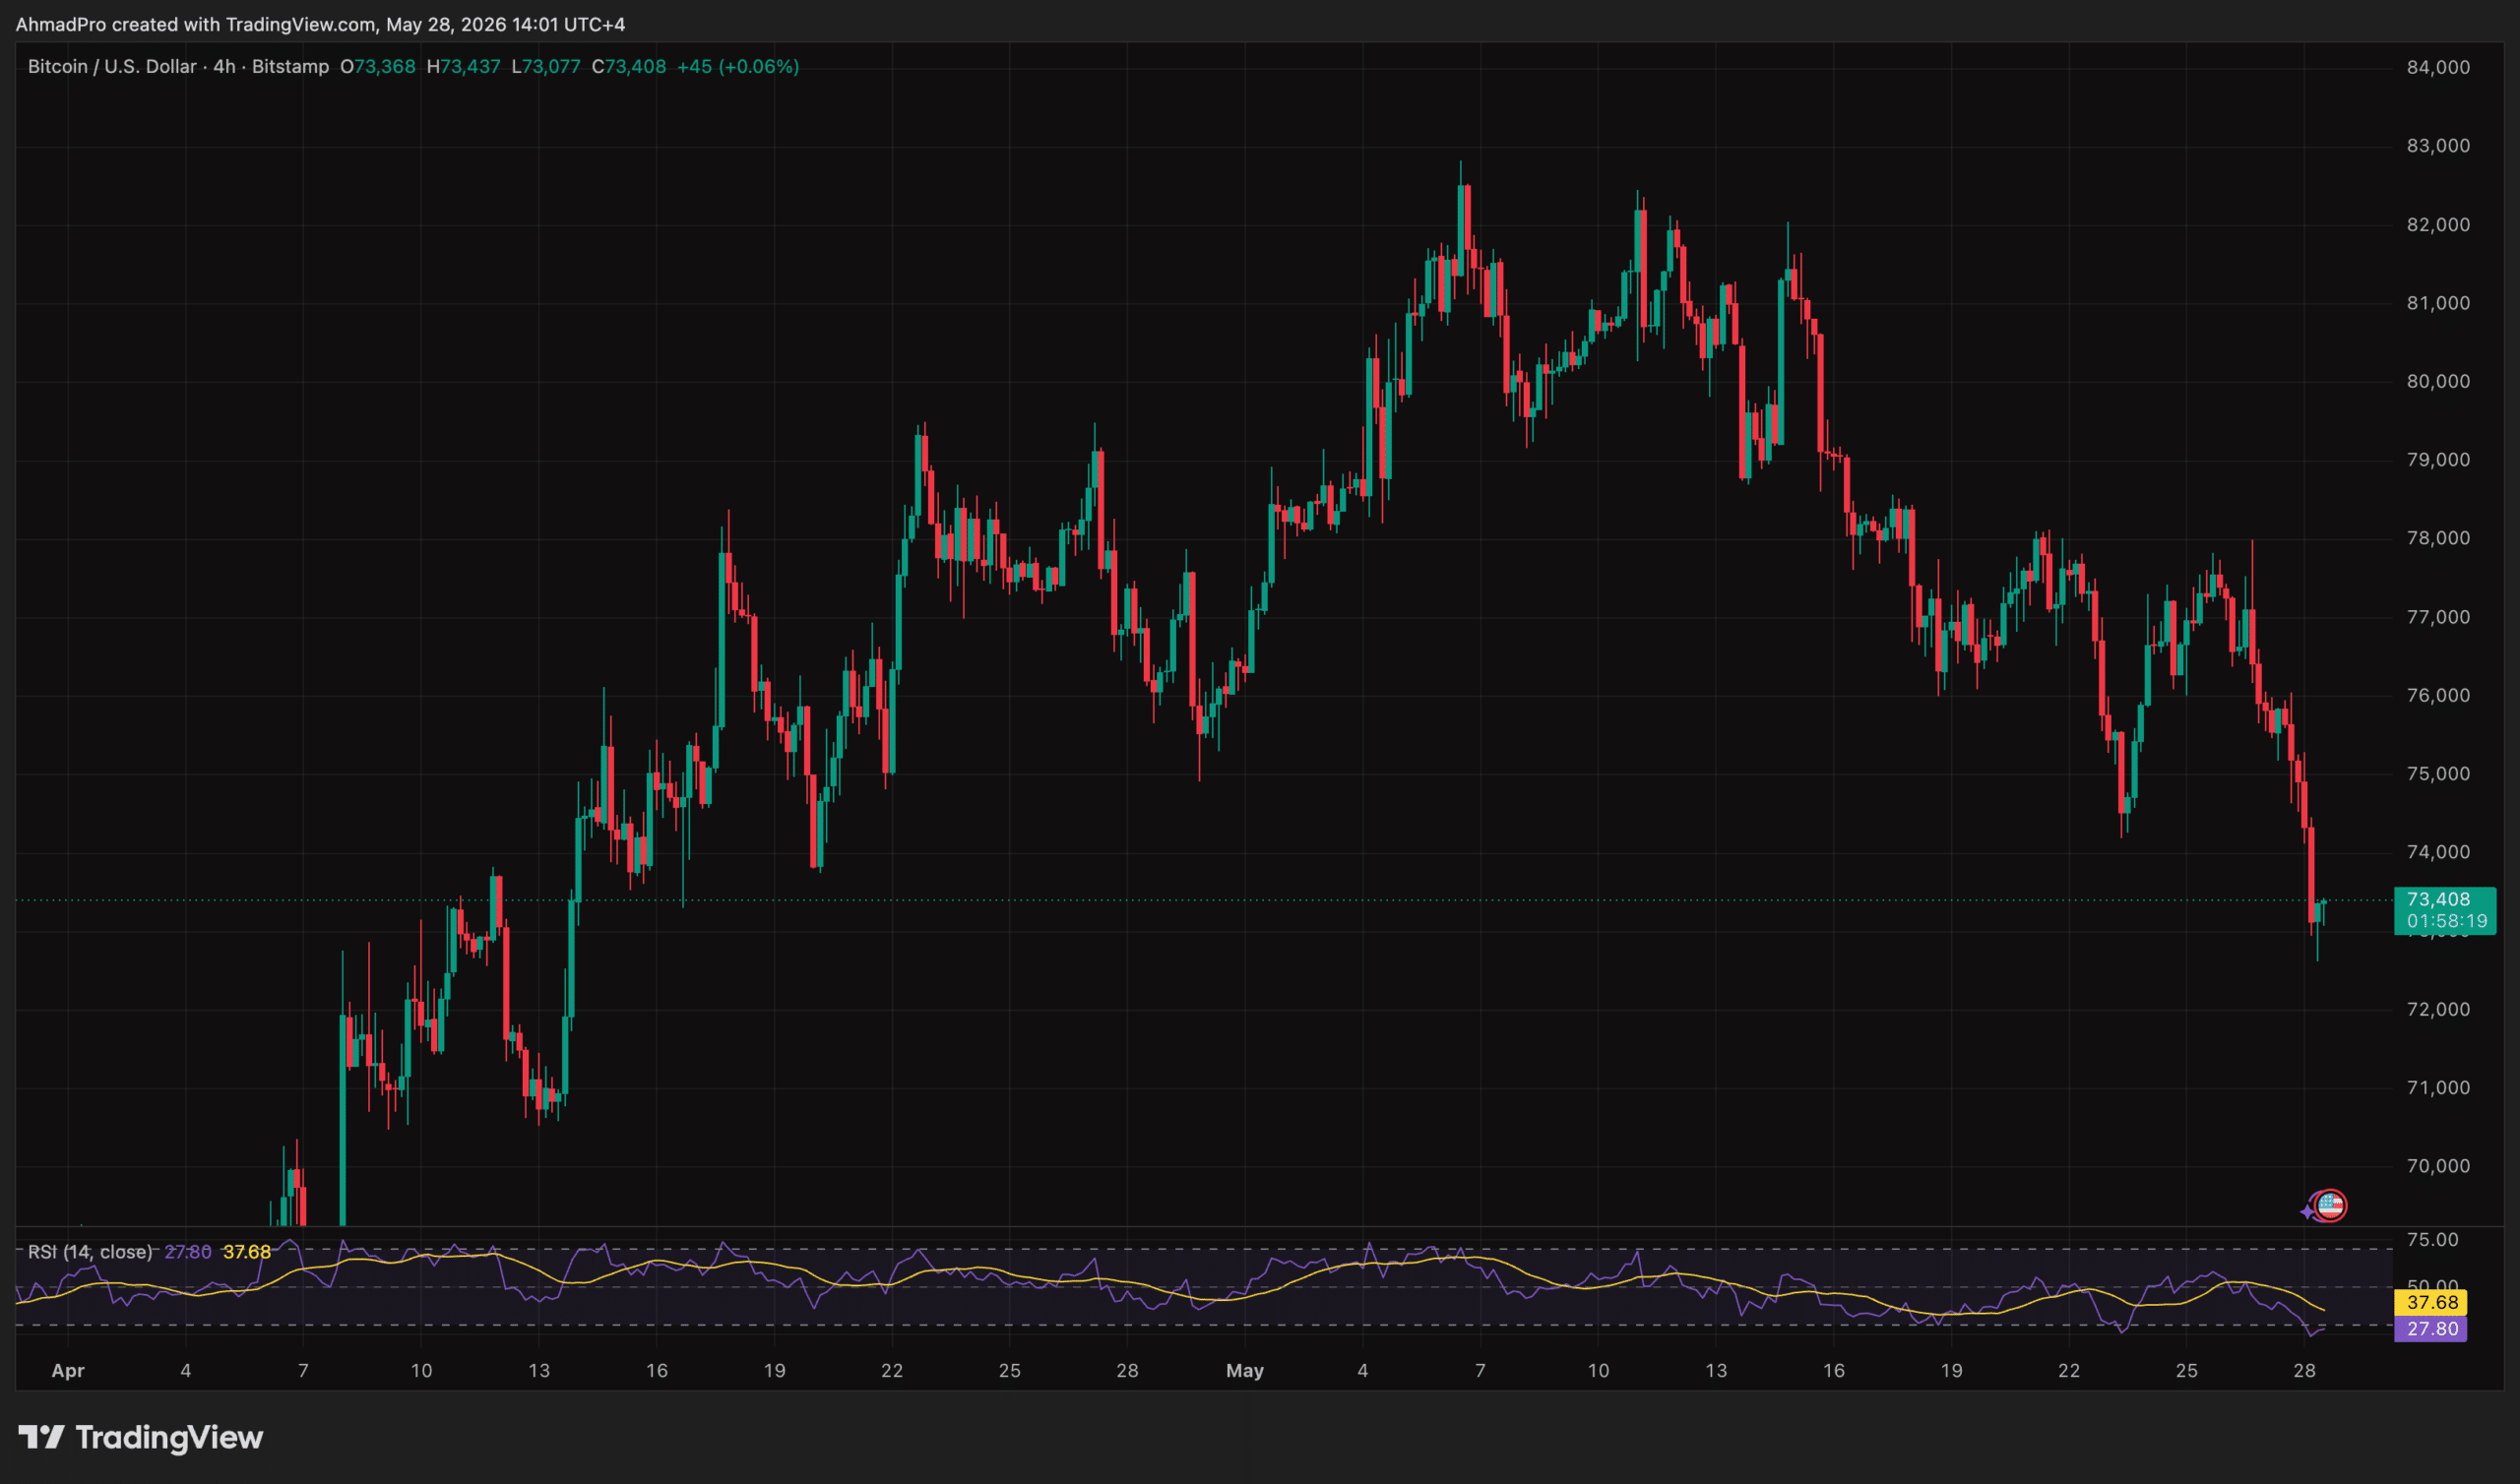
Bitcoin price fell to $72,978 today in Asia, down 3.4% over 24 hours, as news of the US-Iran strike shook the market.
US Central Command’s strike on an Iranian military site near the Strait of Hormuz simultaneously triggered risk-free stock sales, a bid in energy markets and one of the largest single-session deleveraging events in crypto this year.
The analytical question is no longer whether Bitcoin fell following geopolitical news; it’s about whether the safe-haven narrative can survive an episode in which gold and Bitcoin moved in opposite directions during a live kinetic conflict involving U.S. military action.
BREAKING: Iran’s IRGC issues statement saying it retaliated for the US strike on an Iranian military position in the Strait of Hormuz by attacking a US air base in Kuwait.
In their statement, the IRGC asserts that “the aggression will not go unanswered.”
Oil prices are rising almost…
– Kobeissi Letter (@KobeissiLetter) May 28, 2026
DISCOVER: Best Meme Coins to Buy in 2026
Bitcoin News Today: Cross-Asset Transmission and Riskless Repricing Hit Crypto’s Long Bias Structure
The transmission mechanism here was not subtle. The U.S. strikes on Iran have increased the geopolitical risk premium in global markets, pushing capital toward traditional hedges—gold, Treasuries, and to a lesser extent the U.S. dollar—while simultaneously triggering a riskless selloff of high-beta assets.
Bitcoin, despite its store of value framework, has absorbed the risk side of this trade rather than the safe haven side.
Ether fell 4.2% to $1,976, losing the $2,000 mark and extending its seven-day loss to 7.7%. Solana fell 3.5% to $80.57, XRP fell 3.6% to $1.28 and Dogecoin lost 3.2% to $0.0979.
MSCI All Country World Index fell 0.4% from record high; a gauge of Asian stocks fell 1.7%; S&P 500 and Nasdaq 100 futures were both lower. Oil climbed as strikes complicated prospects for reopening the Strait of Hormuz, with Brent crude already well above previous cycle norms following the broader Strait of Hormuz crisis of 2026.
JUST IN: Over $250,000,000 liquidated in the crypto market in the last 15 minutes. pic.twitter.com/ioSzsz2mfq
— Watcher.Guru (@WatcherGuru) May 28, 2026
Analysis of the liquidation confirms that this is a leverage wipeout driven by forced selling rather than deliberate short positioning. A 93% long bias on a nearly $1 billion rally indicates traders were positioned for the rally, not protected against an escalation.
Macro commentators and derivatives desks have increasingly characterized Bitcoin in this conflict cycle as a high-beta macro technology rather than digital gold, highlighting its tight intraday correlation with Nasdaq futures as the most accurate descriptor of its current institutional role. This framework was reinforced on Thursday.
ETF flows have added institutional weight to this movement. BlackRock’s iShares Bitcoin Trust recorded $527.84 million in net outflows on Wednesday – its second single-day withdrawal since its launch in January 2024, missing its all-time high by less than half a million dollars. The 11 U.S. spot Bitcoin ETFs together lost $733.43 million during this session, extending a multi-session streak that withdrew more than $2 billion from the products.
Bitcoin Price Between $72,900 and $73,000: What the Structure Really Shows
The $72,000 to $73,000 area is now the most contested support band on the daily chart. Bitcoin held above $74,000 for several weeks of Iran-related headlines before Thursday’s strikes broke that bottom on high volume, suggesting the level absorbed significant demand before failing — a technically significant distinction from a low-liquidity wick.
Overhead resistance lies in the $74,500-$75,500 range, where prior support now functions as a cap. The 50-day simple moving average, which Bitcoin had used as a recovery guide until May, is reversing — a setup that historically precedes either a deeper test of support or a failed recovery attempt that simulates short-term buyers. The RSI on the daily time frame has fallen towards the 40s, approaching oversold territory without yet reaching the levels that have historically preceded the sharp reversals of this cycle.
Source; Commercial view
A de-escalation signal, whether a ceasefire confirmation, a Strait of Hormuz navigation agreement, or a materially dovish communication from the Fed, allows Bitcoin to reclaim $74,500 within 72 hours and reestablish the previous range. The recovery target is between $76,000 and $77,500 in the event of a sustained close above this level.
If the geopolitical situation remains unresolved and ETF outflows continue at a reduced pace, Bitcoin will advance to between $72,000 and $74,500 over the next few sessions. No directional convictions are developing in either direction, and $72,000 is the structural floor.
A daily close below $72,000, especially if accompanied by continued ETF outflows and further escalation from the Strait of Hormuz, opens a measured move toward the $68,000 to $70,000 support cluster that derivatives analysts have been flagging as the next area of significant demand.
EXPLORE: Crypto Breakout Alerts This Week
following
Disclaimer: Coinspeaker is committed to providing unbiased and transparent reporting. This article is intended to provide accurate and current information, but should not be considered financial or investment advice. Because market conditions can change quickly, we encourage you to verify the information for yourself and consult a professional before making any decisions based on this content.

Daniel Frances is a technical writer and Web3 educator specializing in macroeconomics and DeFi mechanics. Hailing from crypto since 2017, Daniel leverages his experience in on-chain analytics to write evidence-based reports and in-depth guides. He holds certifications from the Blockchain Council and is dedicated to providing “insight gain” that overcomes market hype to find real utility for blockchain.


