


Bitcoin Price Action and Technical Indicators
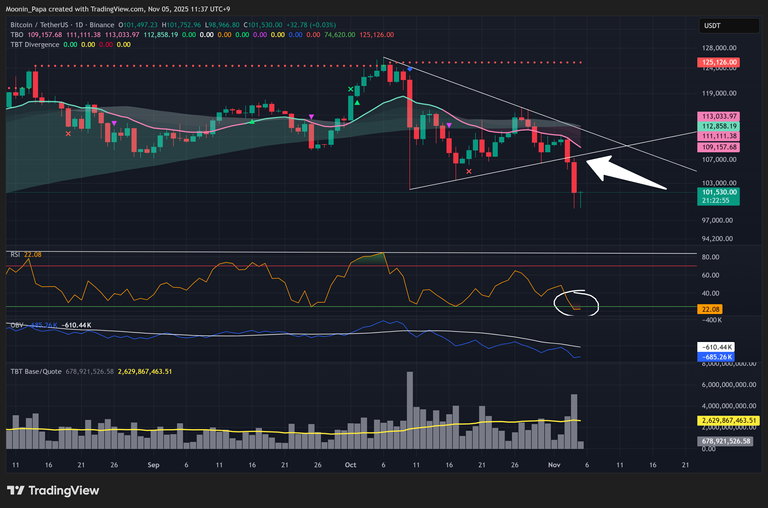
Bitcoin tested short-term support near $106,000 before capitulating yesterday on high volume, falling as low as $98,000. The daily RSI plunged to 21.89, signaling extreme oversold conditions and the possibility of an RSI reset if BTC closes green today. On the 4-hour chart, the recent TBO Breakdown Cluster accurately anticipated this decline, while a weekly TBO Close Long is forming, echoing the September 2024 and April 2025 lows, although the late timing of the bull market warrants caution.

Ethereum and Stablecoin Dominance Dynamics
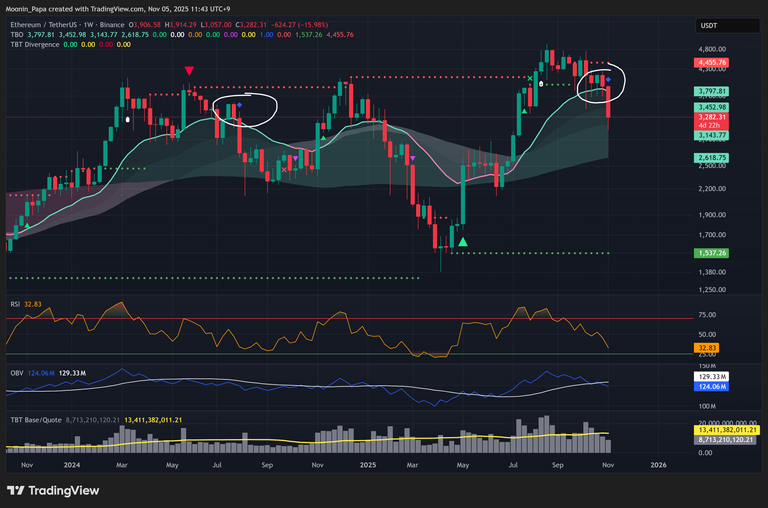
Ethereum’s weekly chart is also printing a TBO Close Long, but the previous formation preceded a further decline towards $1,380. The stablecoin’s combined dominance printed a daily TBO breakout with a maximum RSI of 80.58, entering a “bear market zone” historically associated with very scary events such as the Nikkei crash of August 2024 and the tariff-induced sell-off of April 2025. The absence of relief signals – no bearish TBT divergences or weekly TBO long closes – suggests continued pressure on the metrics stable.
Bitcoin Dominance and Altmarket Capitalization Trends
Bitcoin (BTC.D) dominance increased to 61.41% during the recent pullback, with the daily RSI recording a slightly higher high at 78.07 but failing to hold above TBO resistance. The weekly RSI remains above its overhead resistance, indicating near-term bullish momentum. Conversely, Total Market Dominance (TOTALES.D) confirmed a daily TBO breakdown during this sell-off and shows no daily bullish reversal signals, while remaining below the weekly Ichimoku Cloud, highlighting a bearish stance for a large share of the market.
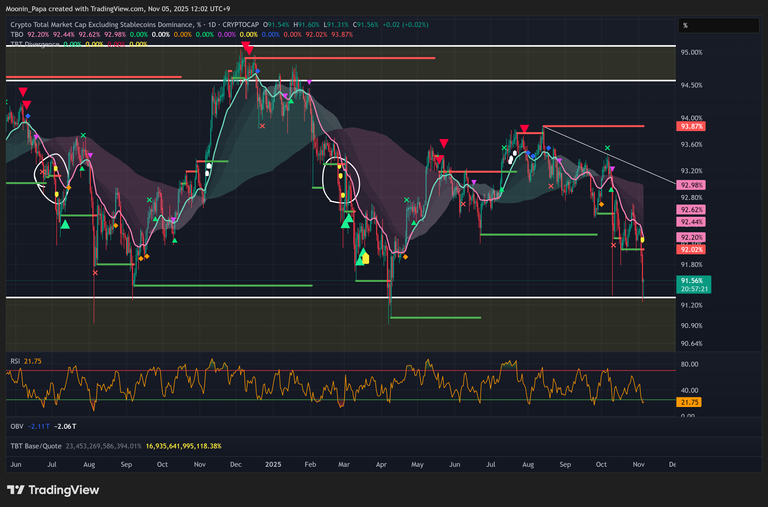
Market Cap Signals and Altcoin’s First Selective Rally
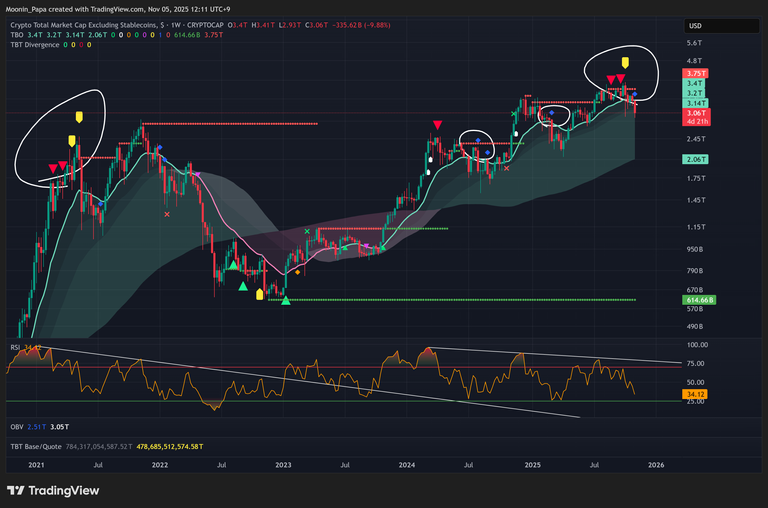
Total Market Cap (TOTALS) is deeply oversold on the daily chart and set for an RSI reset, but remains below the daily TBO cloud in “strongly bearish” mode. Its weekly chart shapes another TBO Close Long, reflecting the bearish divergence clusters of early 2021. Nonetheless, I remain convinced of a selective altcoin rally to close out the year; breakouts from ZEC, DASH, and ICP, as well as valid bullish TBT divergences on the OTHERS/BTC and TOTAL3ESBTC charts, highlight focused opportunities despite broader weakness.
Traditional finance and macroeconomic influences
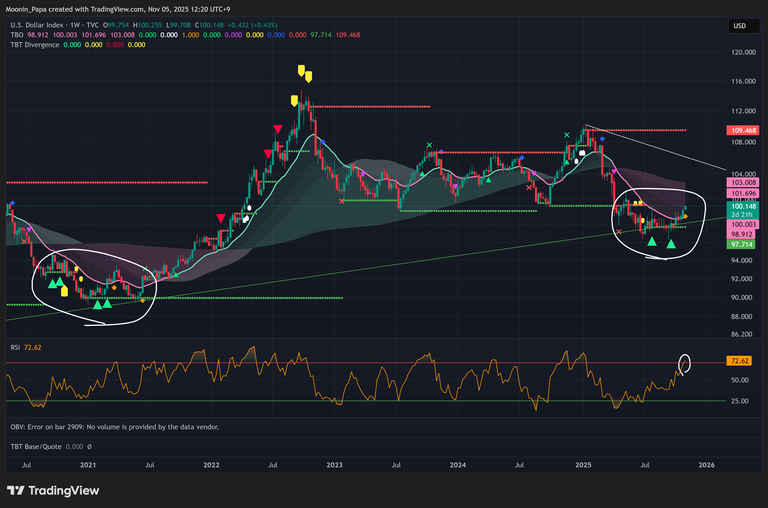
The US Dollar Index (DXY) reached TBO resistance just above 100, printing five consecutive green daily candles and the highest RSI since January. A weekly TBO Close Short is underway with an overbought RSI, echoing the early 2021 pattern that preceded a rally to 114. A stronger dollar generally weighs on currency pairs, US stocks and crypto. S&P futures are lower, forming a second bearish TBT divergence, while the Nikkei and Hang Seng are showing overbought weekly RSI and bearish divergences, signaling further macro headwinds. Gold remains in a bearish consolidation, although growing fear often underpins its drive to become a safe haven.
Short Selling Strategies for a Changing Market
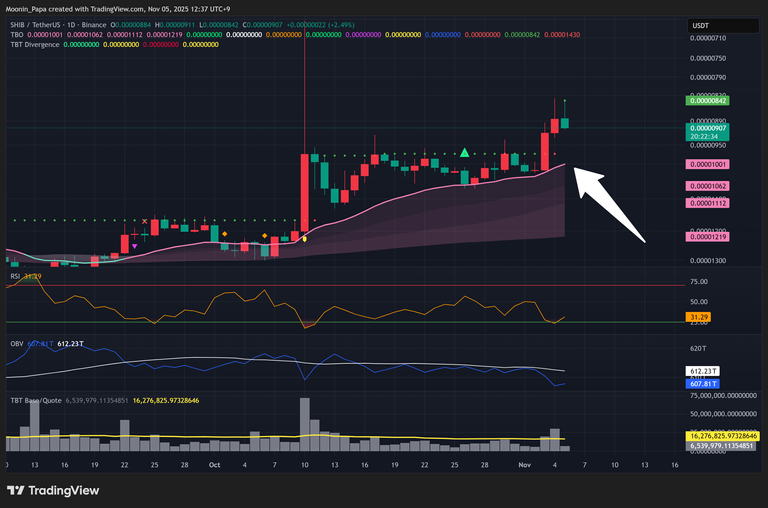
With a bullish to bearish transition likely, refining short selling strategies is essential. Invert your TradingView chart and apply TBO Cloud to identify entries analogous to bullish setups. Monitor the daily direction of the TBO Slow line for trend-aligned bounces and use the backtesting tools in TradingView or Altrady to develop your skills. Meme-based tokens, lacking fundamental utility, often suffer the greatest declines during extended sell-offs, providing asymmetric risk-reward profiles for prepared traders.
Learn about my strategies and the tools I use every day by visiting The Complete Cryptocurrency Investor by Mastering Assets
Disclaimer: The opinions expressed in this article are those of the author and may not reflect those of Kitco Metals Inc. The author has made every effort to ensure the accuracy of the information provided; however, neither Kitco Metals Inc. nor the author can guarantee such accuracy. This article is for informational purposes only. This is not a solicitation to trade any commodities, securities or other financial instruments. Kitco Metals Inc. and the author of this article accept no liability for loss and/or damage arising from the use of this publication.