



Close Menu
Altcoin ObserverAltcoin Observer
  • Regulation
  • Bitcoin
  • Altcoins
  • Market
  • Analysis
  • DeFi
  • Security
  • Ethereum
Categories
  • Altcoins (3,732)
  • Analysis (3,840)
  • Bitcoin (4,470)
  • Blockchain (2,157)
  • DeFi (2,623)
  • Ethereum (2,773)
  • Event (119)
  • Exclusive Deep Dive (1)
  • Landscape Ads (2)
  • Market (2,714)
  • Press Releases (12)
  • Reddit (2,847)
  • Regulation (2,474)
  • Security (4,103)
  • Thought Leadership (3)
  • Videos (44)
Hand picked
  • Uniswap RFC explores running private exchanges using v4 and UniswapX hooks
  • Australia targets Telegram a day after Russia indicts Durov
  • Bitcoin’s weak hands fold
  • Success Story: Jonathan Nichols’ Learning Journey with 101 Blockchains
  • Kraken Cyprus honored at the 14th Invest Cyprus International Investment Awards
We are social
  • Facebook
  • Twitter
  • Instagram
  • YouTube
Facebook X (Twitter) Instagram
  • About us
  • Disclaimer
  • Terms of service
  • Privacy policy
  • Contact us
Facebook X (Twitter) Instagram YouTube LinkedIn
Altcoin ObserverAltcoin Observer
  • Regulation
  • Bitcoin
  • Altcoins
  • Market
  • Analysis
  • DeFi
  • Security
  • Ethereum
Events
Altcoin ObserverAltcoin Observer
Home»Analysis»Bitcoin Price Analysis Reveals Bearish Structure Change?
Analysis

Bitcoin Price Analysis Reveals Bearish Structure Change?

November 10, 2025No Comments
Share Facebook Twitter Pinterest LinkedIn Tumblr Reddit Telegram Email
1f447.png
Share
Facebook Twitter LinkedIn Pinterest Email


Bitcoin has been a source of concern for the crypto community lately. The reason is probably the sharp drop in altcoin prices at a time when they are expected to rip apart. Sentiment on CT (Crypto Twitter) has shifted from bearish to bullish several times over the past two weeks. Follow us and find out what our Bitcoin price analysis reveals about market structure.

BITCOIN – It really is that simple 👇 pic.twitter.com/82diL4OAxl

– Northstar (@NorthstarCharts) November 10, 2025

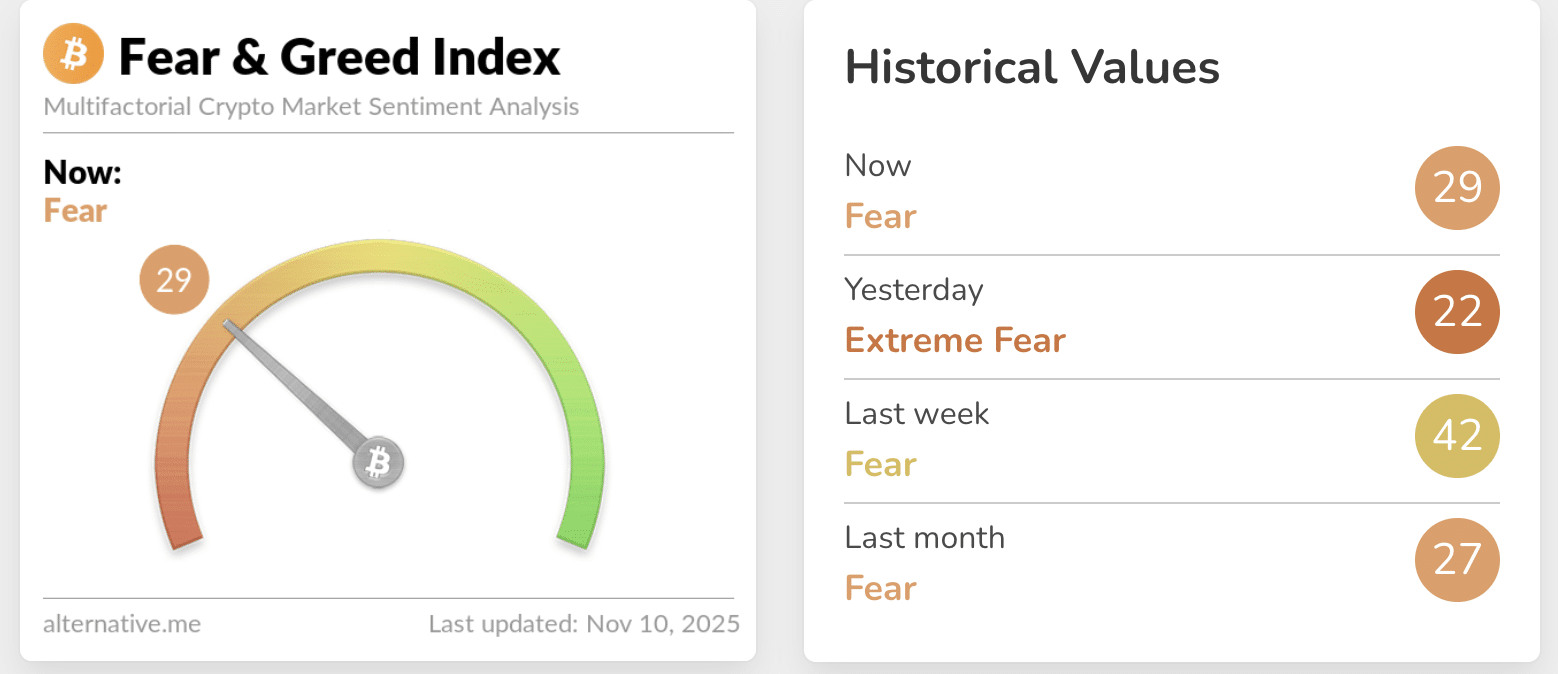
According to NorthstarCharts, we are still in a long-term uptrend and are actually sitting on support. Fear and the green index show more fear than bears would like. Although this indicator is not decisive in itself. It looks like we have just revisited the 20 points for the first time since the start of 2025.
 

(Source – Alternative.me)

Bitcoin Price Analysis Could Hurt Bulls
(Source – Tradingview, BTCUSD)

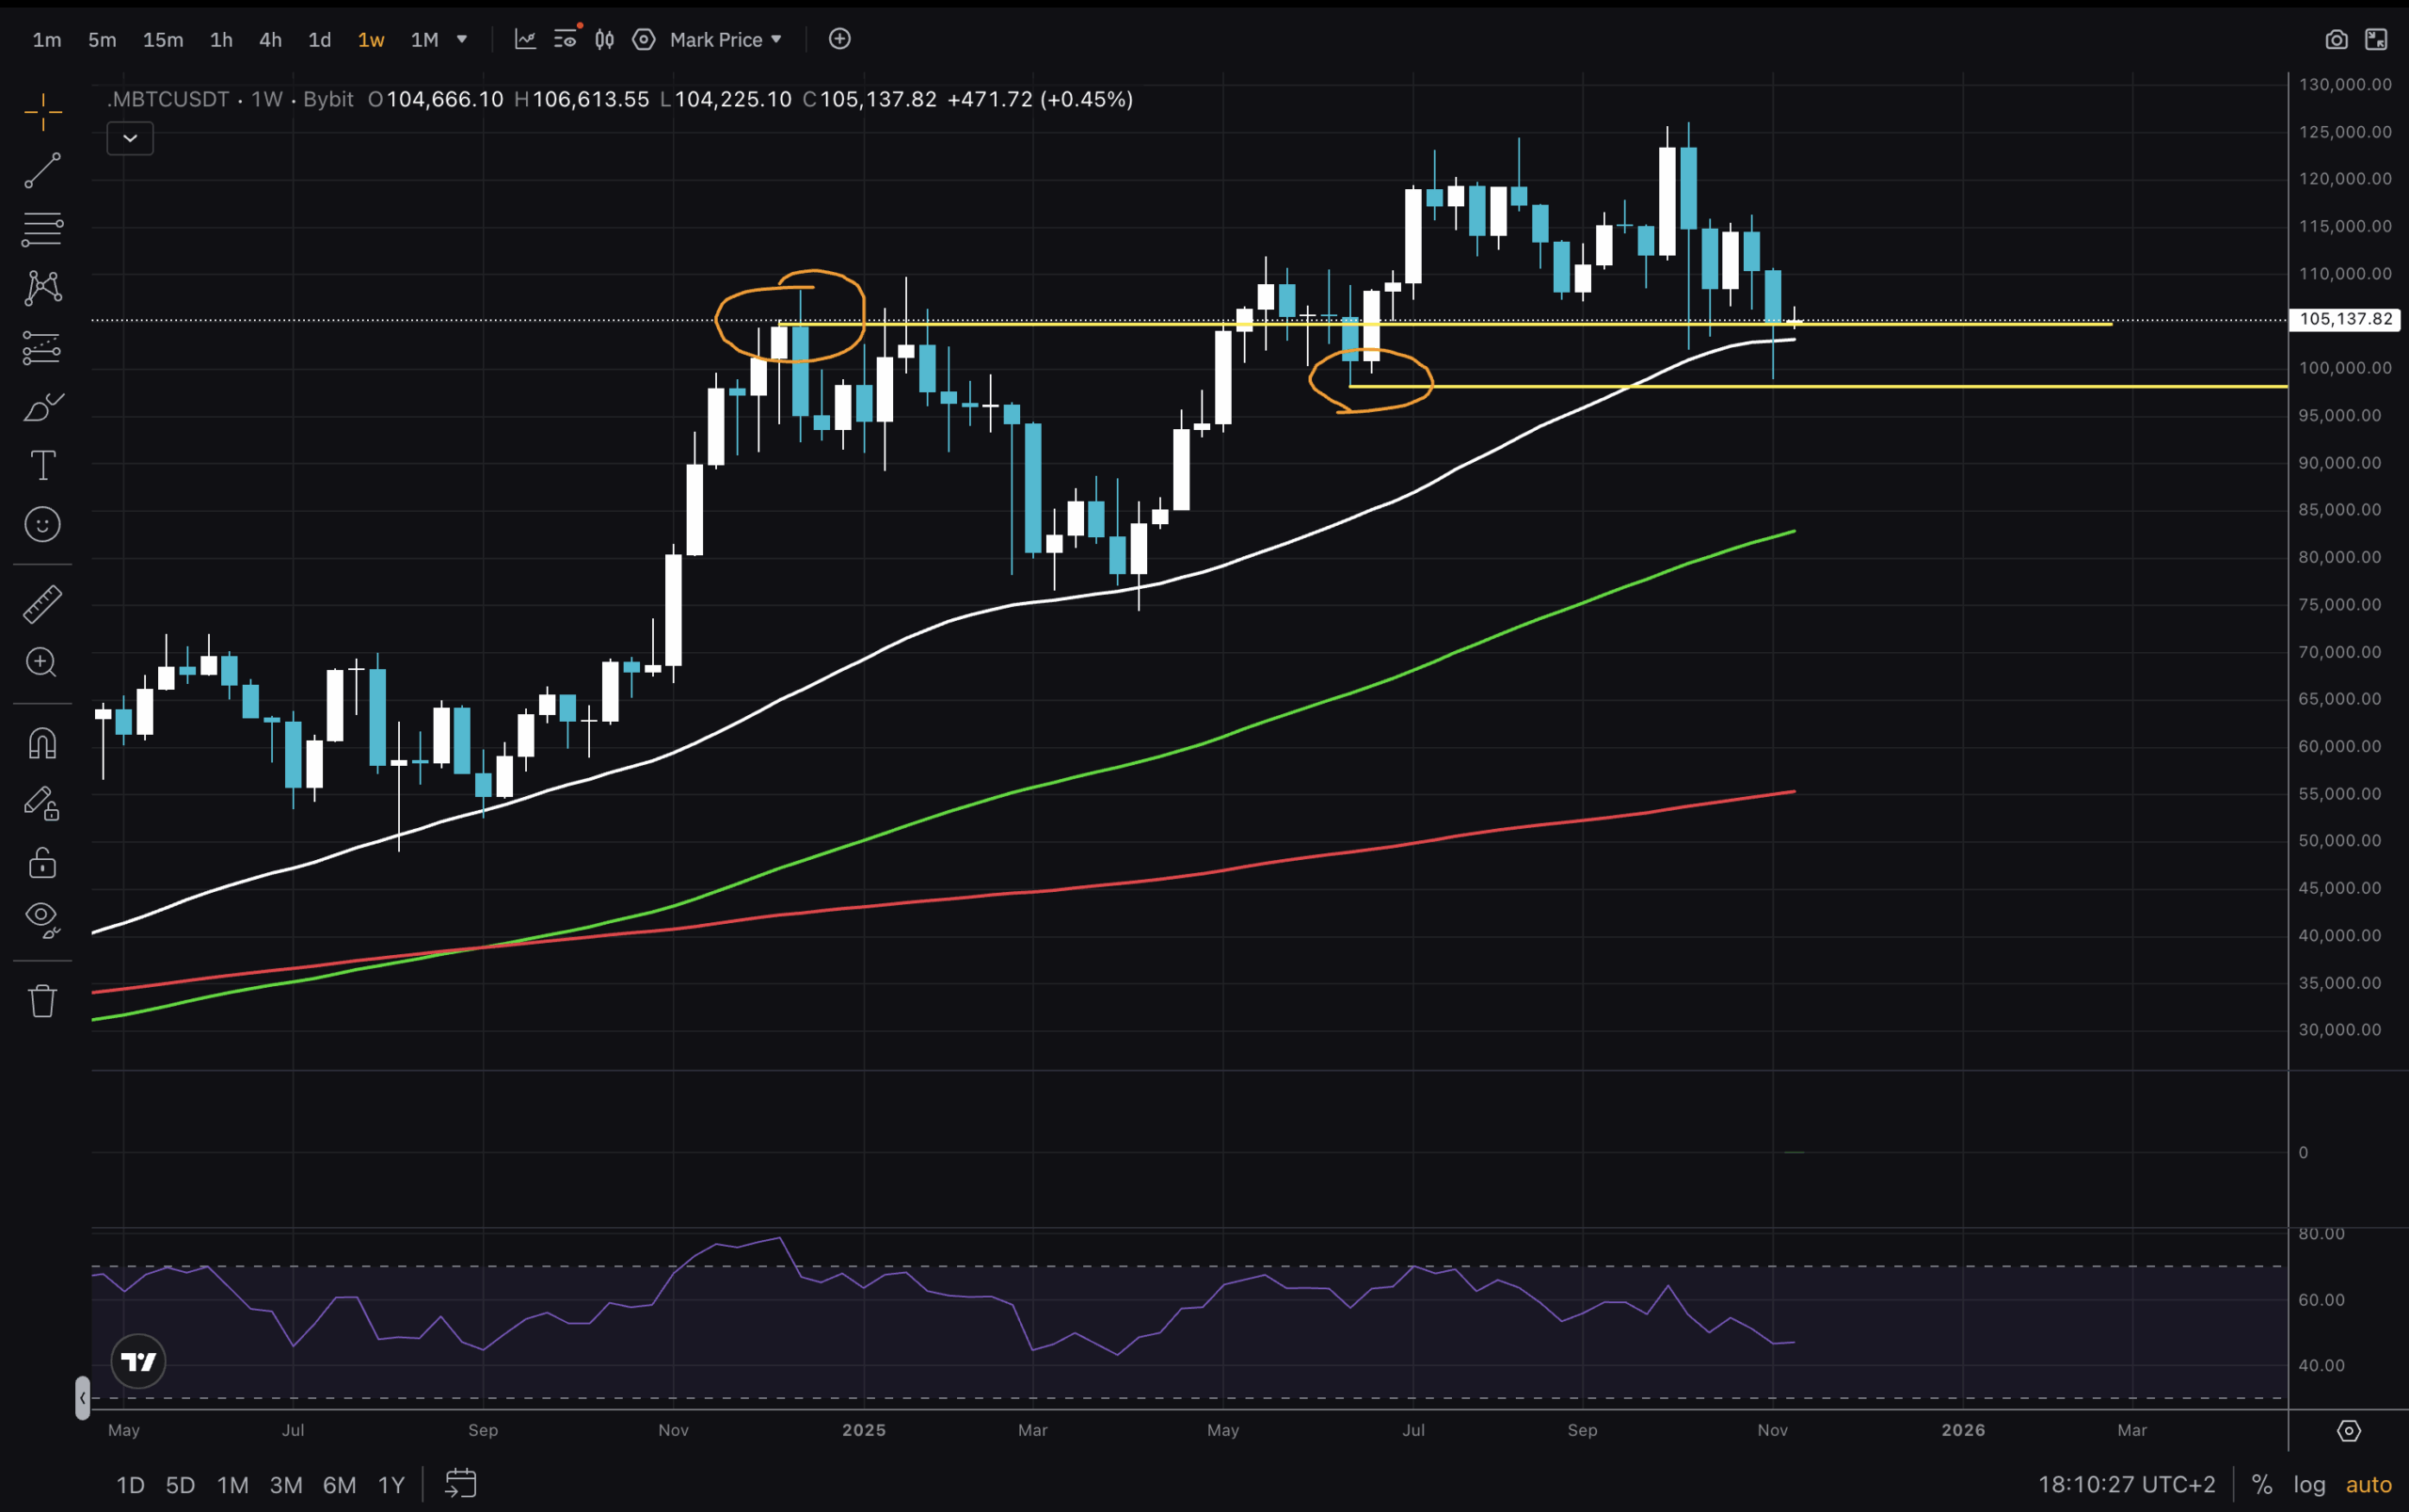
By starting our analysis on the weekly chart, we can see the context in which the market is moving. Bitcoin price is at the MA50 support level, which has bottomed twice in the last year and a half. Additionally, it is trading within the zone defined by the weekly close high of Q4 2024 and the low of Spring 2025. This demand zone of $97,700 to $105,000 currently serves as support.

DISCOVER: The best Meme Coin ICOs to invest in 2025
Has the crypto market taken a turn for the worse? Check out the latest Bitcoin price analysis as we discuss a potentially bearish structure.

(Source – Tradingview, BTCUSD)

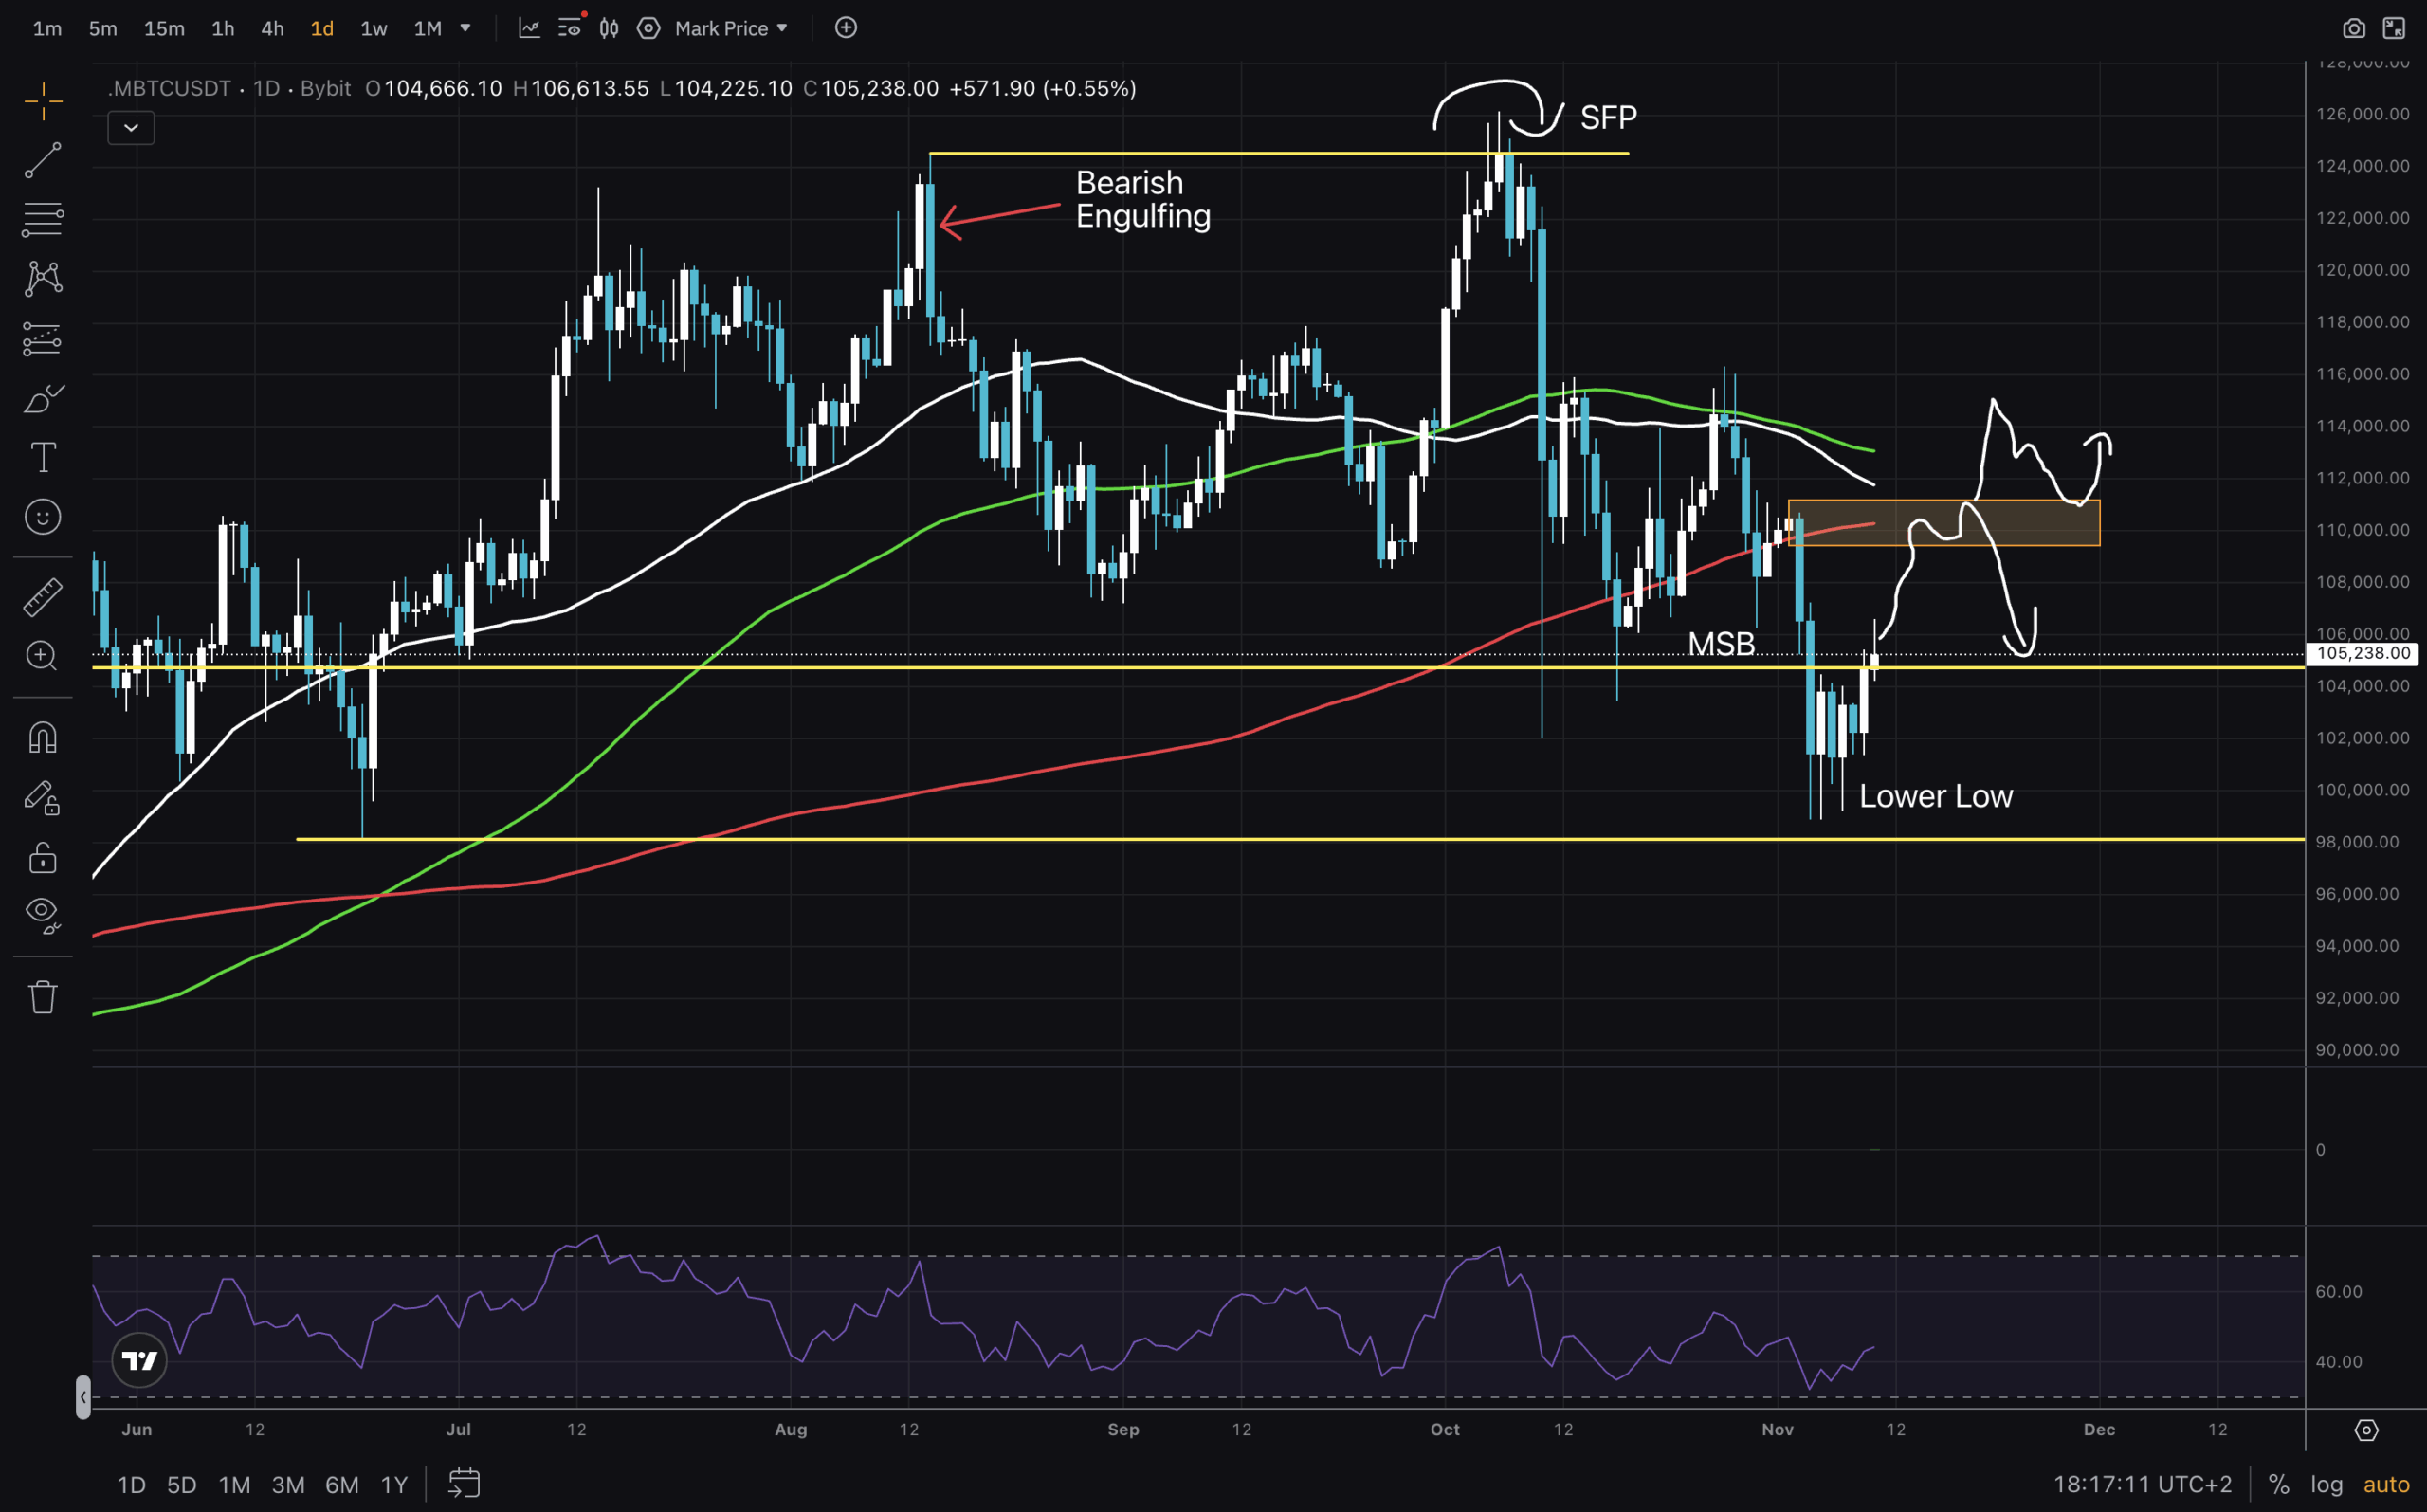
Fear and Greed Index experts say that buying when we are at the fear level is a good DCA strategy. Being low on this scale can turn this low on the daily chart into a gap. But the bulls have a lot of work to do. Two scenarios in which this may be true are a continued push toward the orange box, where it appears the AMs will meet.

Then either a rejection and retest of $105,000 for support, or a pass through the box and retest of $110,000 for support. Now that the RSI is at a low level, there is ample room for a price surge.

DISCOVER: The Best Solana Meme Coins to Buy in 2025

What does Bitcoin do on short time frames?
(Source – Tradingview, BTCUSD)

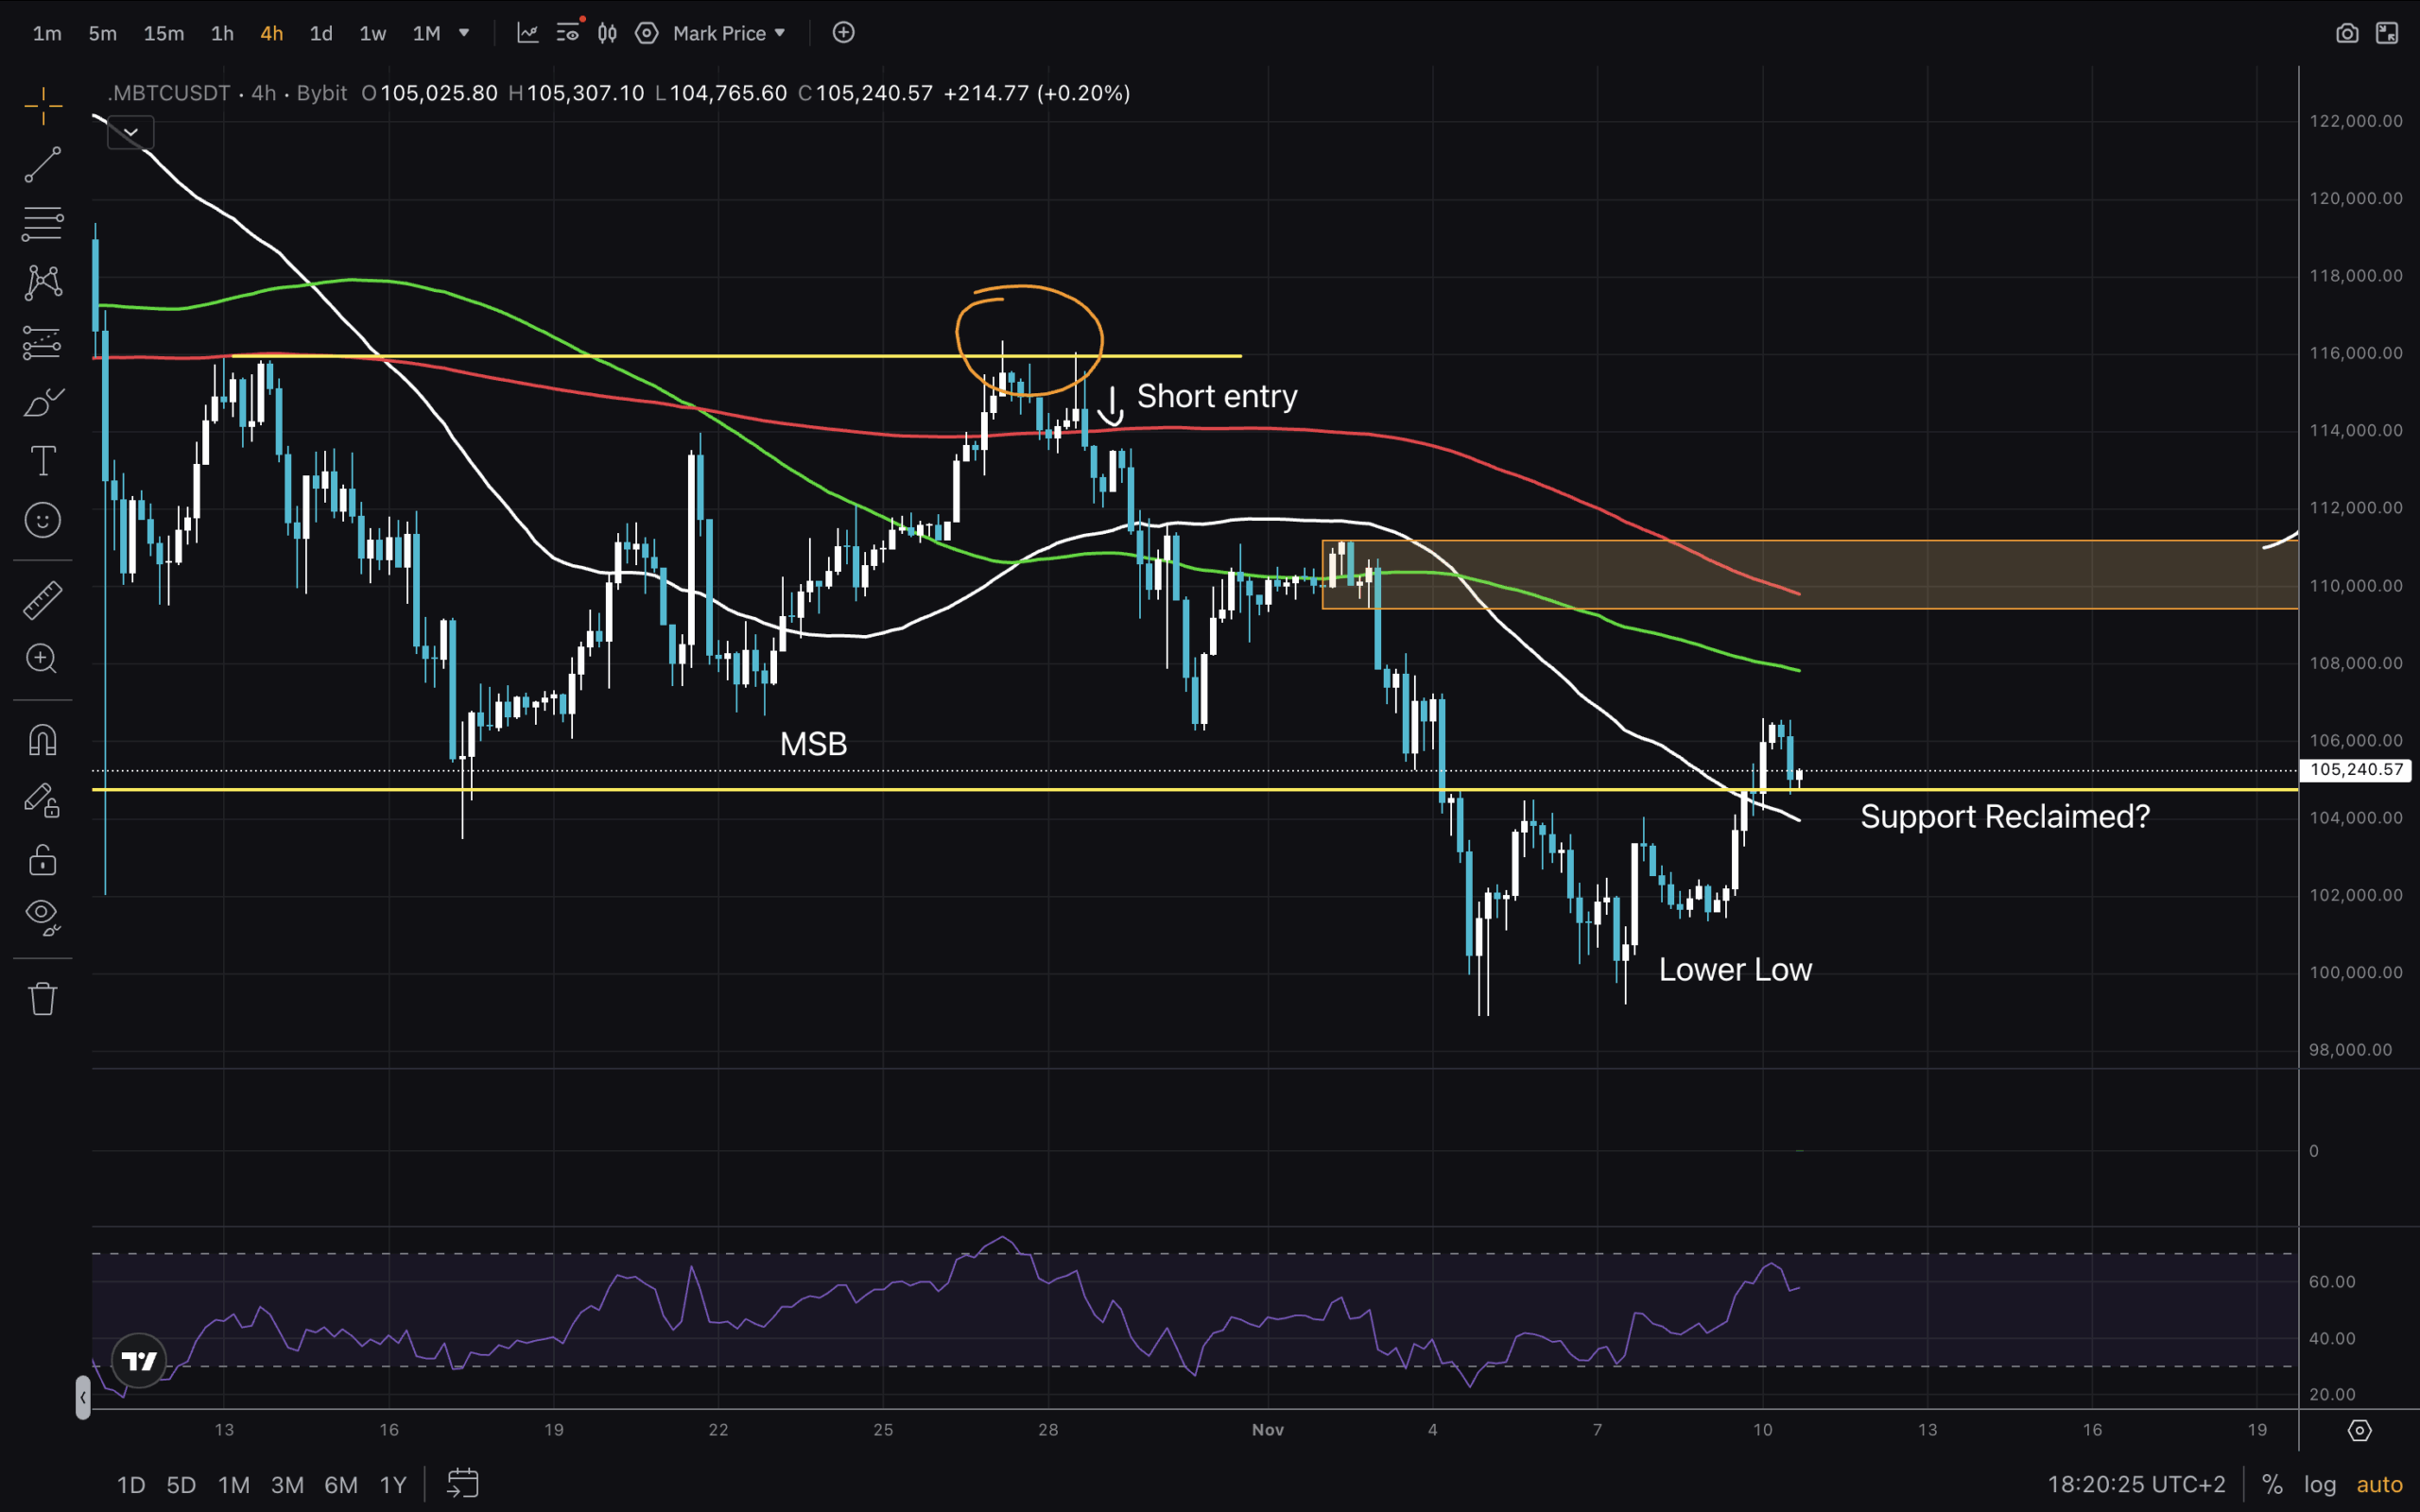
For traders, it is important to know how to trade in both directions of the market. On this 4H chart we can see an excellent setup for the short term. I scored the high formed after the SFP. Once the $116,000 level was rejected and the price fell back below the MA200, this was our trigger. Entry at ~112,500 with a stop at $116,000. Easy 2R to the $105,000 support and a 3R+ trade to the lower low.

Now, for the bulls, the hope is that this $105,000 will actually be recouped. The next resistors would be the MA100 and MA200. If we return to the range, there is still hope. Otherwise, we continue this correction.

Happy trading and stay safe!

DISCOVER: Top 20 cryptocurrencies to buy in 2025

Join the 99Bitcoins News Discord here for the latest market updates

Bitcoin Price Analysis Reveals Bearish Structure Change?

  • RSI on Daily now has room to grow.

  • The 4H chart shows bearish factors, with an MSB.

  • If the $105,000 recovery is strong, we can expect a move to $110,000.

  • Currently in a bearish structure on Daily

  • Still in a bullish structure over the week

Bitcoin price analysis reveals a bearish structure change? appeared first on 99Bitcoins.


Source link

Share. Facebook Twitter Pinterest LinkedIn Tumblr Email
Previous ArticleAutonomous Payments: AI-Driven Financial Transactions in Web3 and DeFi
Next Article Zcash Price Rebounds as Open Interest Surpasses $1 Billion

Related Posts

Analysis

Bitcoin’s weak hands fold

July 30, 2026
Analysis

CLARITY Act Delay Shows Fight Against Crypto Market Structure Is Not Over

July 30, 2026
Analysis

CLARITY Act delay risks taking US lead on crypto, lawmaker warns

July 28, 2026
Add A Comment
Leave A Reply Cancel Reply

Single Page Post
Share
  • Facebook
  • Twitter
  • Instagram
  • YouTube
Featured Content
Event

Dutch Blockchain Week 2026 strengthens position as Europe’s leading B2B blockchain event week

April 14, 2026

Amsterdam, April 2026 – Dutch Blockchain Week 2026 is rapidly evolving into one of Europe’s…

Event

Global Games Show Riyadh: The Ultimate Creator & Influencer Hub

March 31, 2026

The fast-evolving gaming ecosystem of Riyadh is powered by solid national investment, a flourishing esports…

1 2 3 … 82 Next
  • Facebook
  • Twitter
  • Instagram
  • YouTube

Australia targets Telegram a day after Russia indicts Durov

July 30, 2026

Ethena whales withdraw 102 million tokens from exchanges: has ENA selling pressure eased?

July 30, 2026

Audiera loses KEY support – can BEAT recover from 24% crash?

July 29, 2026
Facebook X (Twitter) Instagram LinkedIn
  • About us
  • Disclaimer
  • Terms of service
  • Privacy policy
  • Contact us
© 2026 Altcoin Observer. all rights reserved by Tech Team.

Type above and press Enter to search. Press Esc to cancel.

bitcoin
Bitcoin (BTC) $ 75,686.00
ethereum
Ethereum (ETH) $ 2,232.94
tether
Tether (USDT) $ 0.998952
bnb
BNB (BNB) $ 695.27
xrp
XRP (XRP) $ 1.16
usd-coin
USDC (USDC) $ 0.999491
solana
Solana (SOL) $ 89.33
tron
TRON (TRX) $ 0.319972
staked-ether
Lido Staked Ether (STETH) $ 2,265.05
figure-heloc
Figure Heloc (FIGR_HELOC) $ 1.07