


Join our Telegram channel to stay up to date with the latest news
The price of Bitcoin fell 7.5% over the past 24 hours to trade at $84,020 as of 2:46 a.m. EST on trading volume that increased 22% to $102 billion.
BTC fell to its lowest level since April as mixed U.S. jobs data dampened expectations of a Federal Reserve rate cut next month, sparking a fresh round of selling.
The US jobs report showed payrolls increased by 119,000 while the employment rate climbed to 4.4%, showing CME Group’s FedWatch tool. there is only a 41% chance that a rate cut will occur next month.
September employment numbers are out (September numbers, NOT October numbers) and they have exceeded expectations as businesses are hiring.
However, employment revisions are down from July, so the rate cut odds are split 60/40 to NO RATE CUTS in December. pic.twitter.com/2j39uwcsgk
– Digital Asset News (@NewsAsset) November 20, 2025
Meanwhile, Bridgewater Associates founder Ray Dalio told CNBC in an interview that the market is in bubble territory.
Dalio said investors shouldn’t necessarily rush to sell their holdings, but warned of very low returns over the next decade.
RAY DALIO: “THERE IS DEFINITELY A BUBBLE IN THE MARKETS.” pic.twitter.com/KXRA2gD6nM
– The wolf of all streets (@scottmelker) November 20, 2025
With the chances of a rate cut reduced, where does Bitcoin go from here?
Bearish Bitcoin price stance dampens recovery hopes
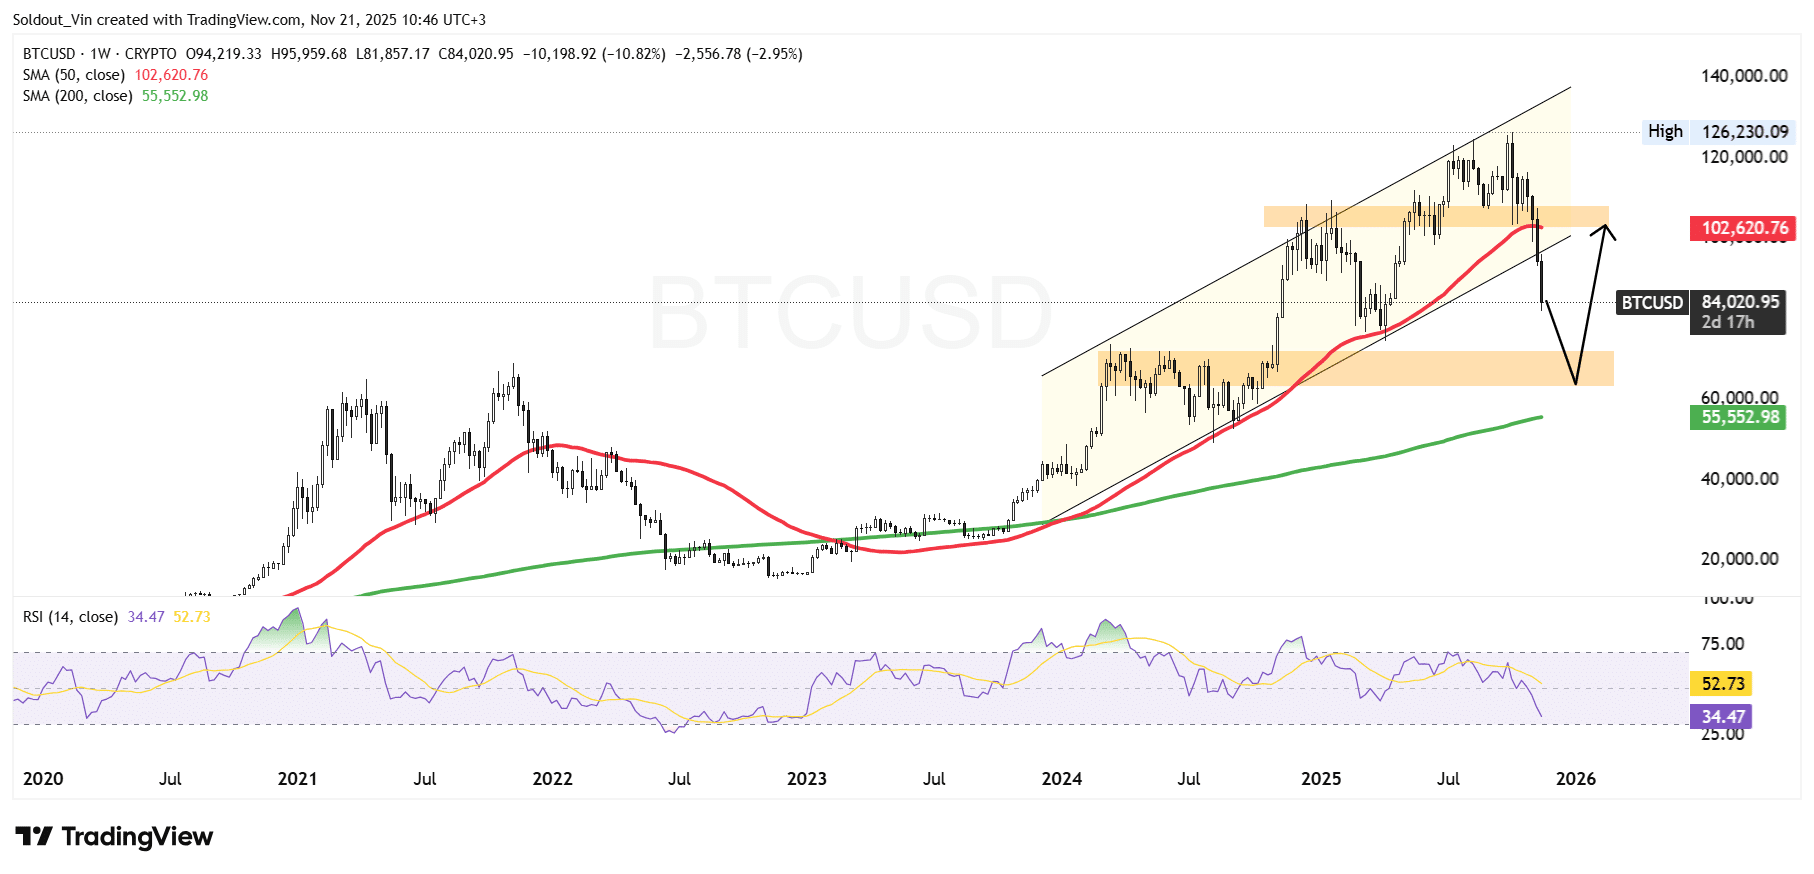
After a sustained rally from the $40,000 region through 2023 and 2024, the BTC Price has been climbing steadily in an ascending channel pattern.
However, as the Bitcoin price approached $125,000, the bullish momentum began to weaken. Repeated rejections near the upper boundary of the ascending channel signaled exhaustion, eventually leading to a significant reversal from the cycle high around $126,230.
However, the bears appear to have taken control of the price as the breakdown accelerated once BTC fell below the 50 weekly simple moving average (SMA), currently near $102,600.
Historically, the 50-week SMA has served as a crucial trend indicator, and its breakdown often signals the start of a deeper correction. Multiple failed recovery attempts around this level further confirmed the weakening trend, reinforcing the bearish sentiment.
As the selling intensified, Bitcoin descended into the lower part of the channel and now continues to slide towards the next major demand region between $65,000 and $70,000. This area represents a prior consolidation range and aligns with historical support from the early stages of the rally, making it a critical area for potential stabilization.
Further strengthening the bearish stance, the weekly Relative Strength Index (RSI) fell sharply to 34, approaching oversold territory. Although still above the 30 threshold, the indicator shows intensified selling pressure with bears dominating the entire market.
BTC Price Prediction
Based on current weekly chart analysis of BTC/USD, bears remain in control as Bitcoin trades significantly below the 50-week SMA and heads towards the major demand region below $70,000.
The loss of the channel’s midline and the sharp decline in the RSI support the broader downward trajectory.
If the bearish pressure persists, BTC price could test the $65,000-$70,000 support range, where buyers could attempt to reestablish control.
A break below this region would open the door for a deeper correction towards the long-term 200-week SMA near $55,500.
However, approaching oversold conditions in the RSI could fuel a temporary relief rebound. In such a scenario, recovery attempts may first encounter resistance near the $100,000 zone, aligned with the 50-week SMA and previous breakout support.
Recent news:
Best Wallet – Diversify your crypto portfolio

- Easy-to-use, feature-driven crypto wallet
- Get Early Access to Upcoming Token ICOs
- Multi-chain, multi-wallet, non-custodial
- Now on App Store, Google Play
- Stake to win a $BEST native token
- More than 250,000 active users per month
Join our Telegram channel to stay up to date with the latest news