




Join our Telegram channel to stay up to date with the latest news
The price of Bitcoin retreated over the past 24 hours to trade at $90,430 as of 1:15 a.m. EST as the crypto market took a major hit, falling 2.5% to a market cap of $3.18 trillion as the Fear and Greed Index slipped back to fear.
Technical analysis shows that Bitcoin’s price has retreated, albeit after a sustained rise earlier this year that saw the asset surpass $93,500.
Greed and Fear Index Falls to Fear as Bitcoin Sees Heavy Selling Pressure
According to CoinMarketCap According to the data, the cryptocurrency market fell by 2.5% in the last 24 hours, with Bitcoin still unable to sustain its rise above $93,000.
Crypto Fear and Greed Index The currency briefly moved closer to neutral on Wednesday, but has since fallen back into the “fear” zone, signaling weakening investor confidence and reduced risk appetite.

Due to this drop, more than 111,000 traders were liquidated, with total liquidations totaling $364.56 million, according to CoinGlass data.
Meanwhile, according to analyst Maartunn, Bitcoin net buying volume reached -$19 million on the 25-hour MA, indicating the strongest selling pressure since December 23.
Net taker volume (25H MA) just reached -$19 million — the strongest selling pressure since December 23 🔻
Aggressive sellers regain control. pic.twitter.com/4XWX1bTm5P
– Maartunn (@JA_Maartun) January 7, 2026
This indicates that sellers are regaining control of the market in the short term. Net Take Volume calculates the spread between buy and sell volumes of market orders. Therefore, a negative reading reflects aggressive selling activity.
Meanwhile, data from Blockchain.com shows that the 200-week moving average remains below the BTC price, supporting a positive market narrative.
Bitcoin Price Risks Drop Below $89,000
Bitcoin price is down 2% over the past 24 hours as the crypto has pulled back from the $93,500 zone on the daily chart over the past 2 days.
As the BTC/USD chart shows, the last two candles indicate the BTC Price is currently in correction after a sustained increase.
Bitcoin is still trading well above the 50-day simple moving average (SMA), indicating that the price remains bullish in the near term.
Meanwhile, Bitcoin price is supported by the key Fibonacci retracement levels at 0.382 ($89,336) and 0.5 ($87,657).
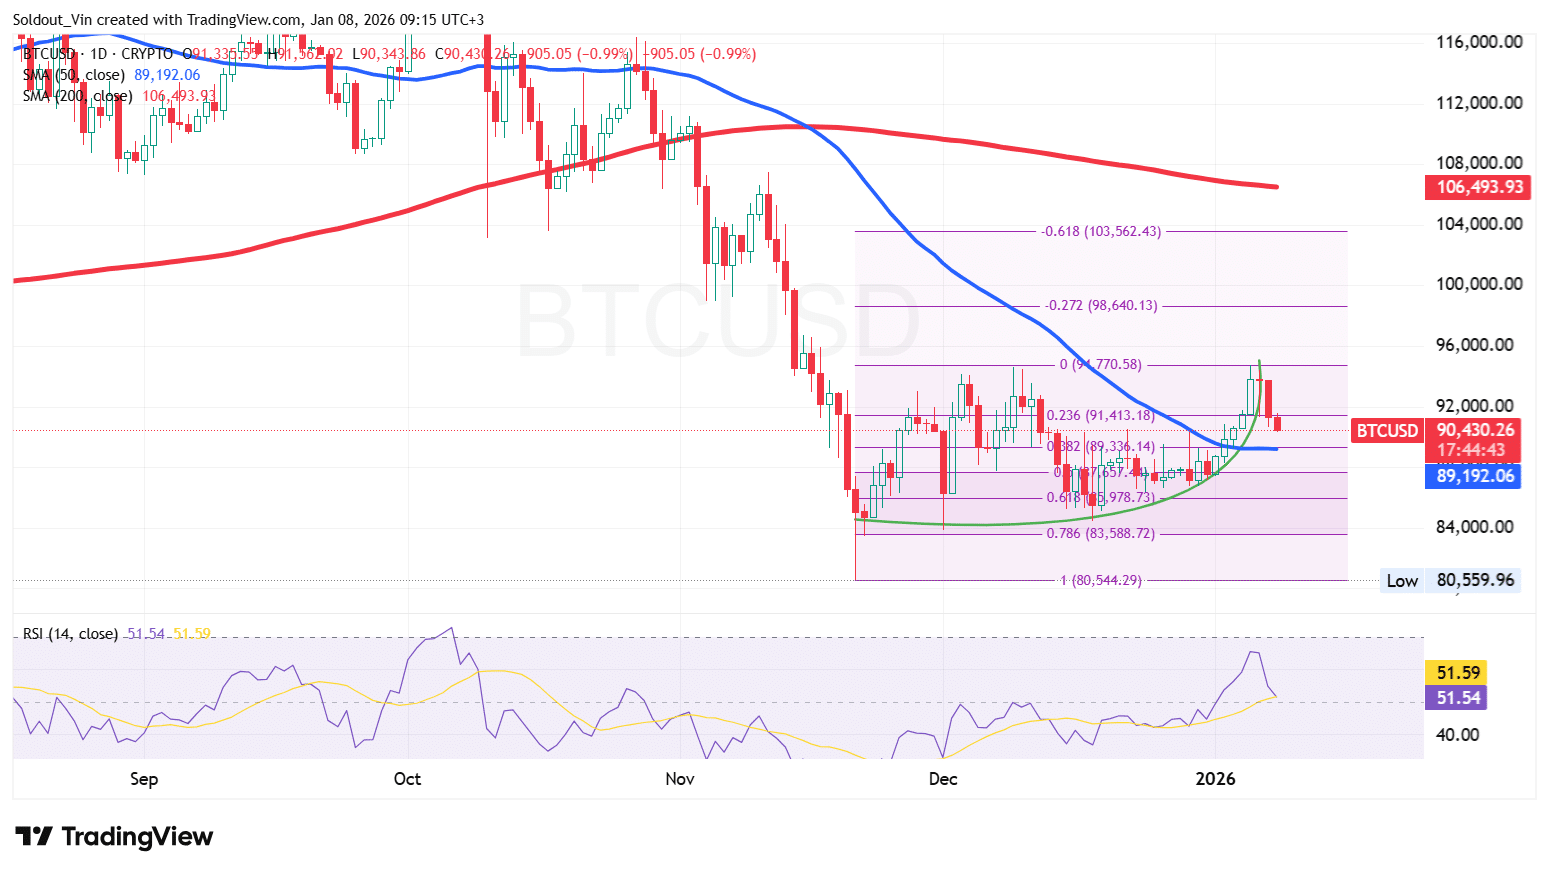
Meanwhile, the Relative Strength Index (RSI) drops from 66 to 51.54, indicating that sellers are intervening or taking profits after the new year’s rally.
Based on the BTC/USD chart analysis on the daily time frame, BTC price could further fall back to $89,192 (50-day SMA), but the level acts as strong support. This scenario shows that investors are cautious about any slight movement.
As traders face indecision, Ali Martinez, a prominent crypto analyst at X, says any price direction depends on BTC closing below $88,000 or $94,000.
Bitcoin $BTC needs a daily close between $88,000 and $94,000 to confirm the direction of the trend. pic.twitter.com/T8ayEUCS8d
– Ali Charts (@alicharts) January 8, 2026
If the bearish pressure persists, Bitcoin is likely to fall below the $89,000 level, with the 0.5 and 0.618 Fib levels serving as immediate support at $87,657 and $85,978, respectively.
However, if the 50-day SMA holds Bitcoin price, the asset could further rise in the long term, with $94,000 and $98,640 as the next target zones on the Fibonacci chart.
Related news:
Best Wallet – Diversify your crypto portfolio

- Easy-to-use, feature-driven crypto wallet
- Get Early Access to Upcoming Token ICOs
- Multi-chain, multi-wallet, non-custodial
- Now on App Store, Google Play
- Stake to win a $BEST native token
- More than 250,000 active users per month
Join our Telegram channel to stay up to date with the latest news


