




Today’s Bitcoin price forecast is difficult to read, as BTC USD hit an intraday low of $75,100 today, after two catalysts hit simultaneously: the Federal Reserve kept its benchmark rate steady between 3.5 and 3.75%, and President Trump publicly rejected Iran’s proposal to reopen the Strait of Hormuz.
This combination, hawkish Fed policy responding to an active geopolitical flashpoint, sent BTC sliding through a technical bottom that analysts had been closely watching for weeks.
Trump Detroit.
I finished
pic.twitter.com/RnhdaJrT5w
– Ted (@TedPillows) April 30, 2026

The decline briefly pushed Bitcoin USD below its 20-day simple moving average of $75,664, a level that serves as a short-term speed limit for the market; break it convincingly and sellers gain confidence.
BTC has recovered to around $75,700 at press time, but the question now is whether this is a typical weak-hand reshuffle or the start of something more substantial. The rest of this article explains exactly what charts, on-chain data, and macro context tell us.
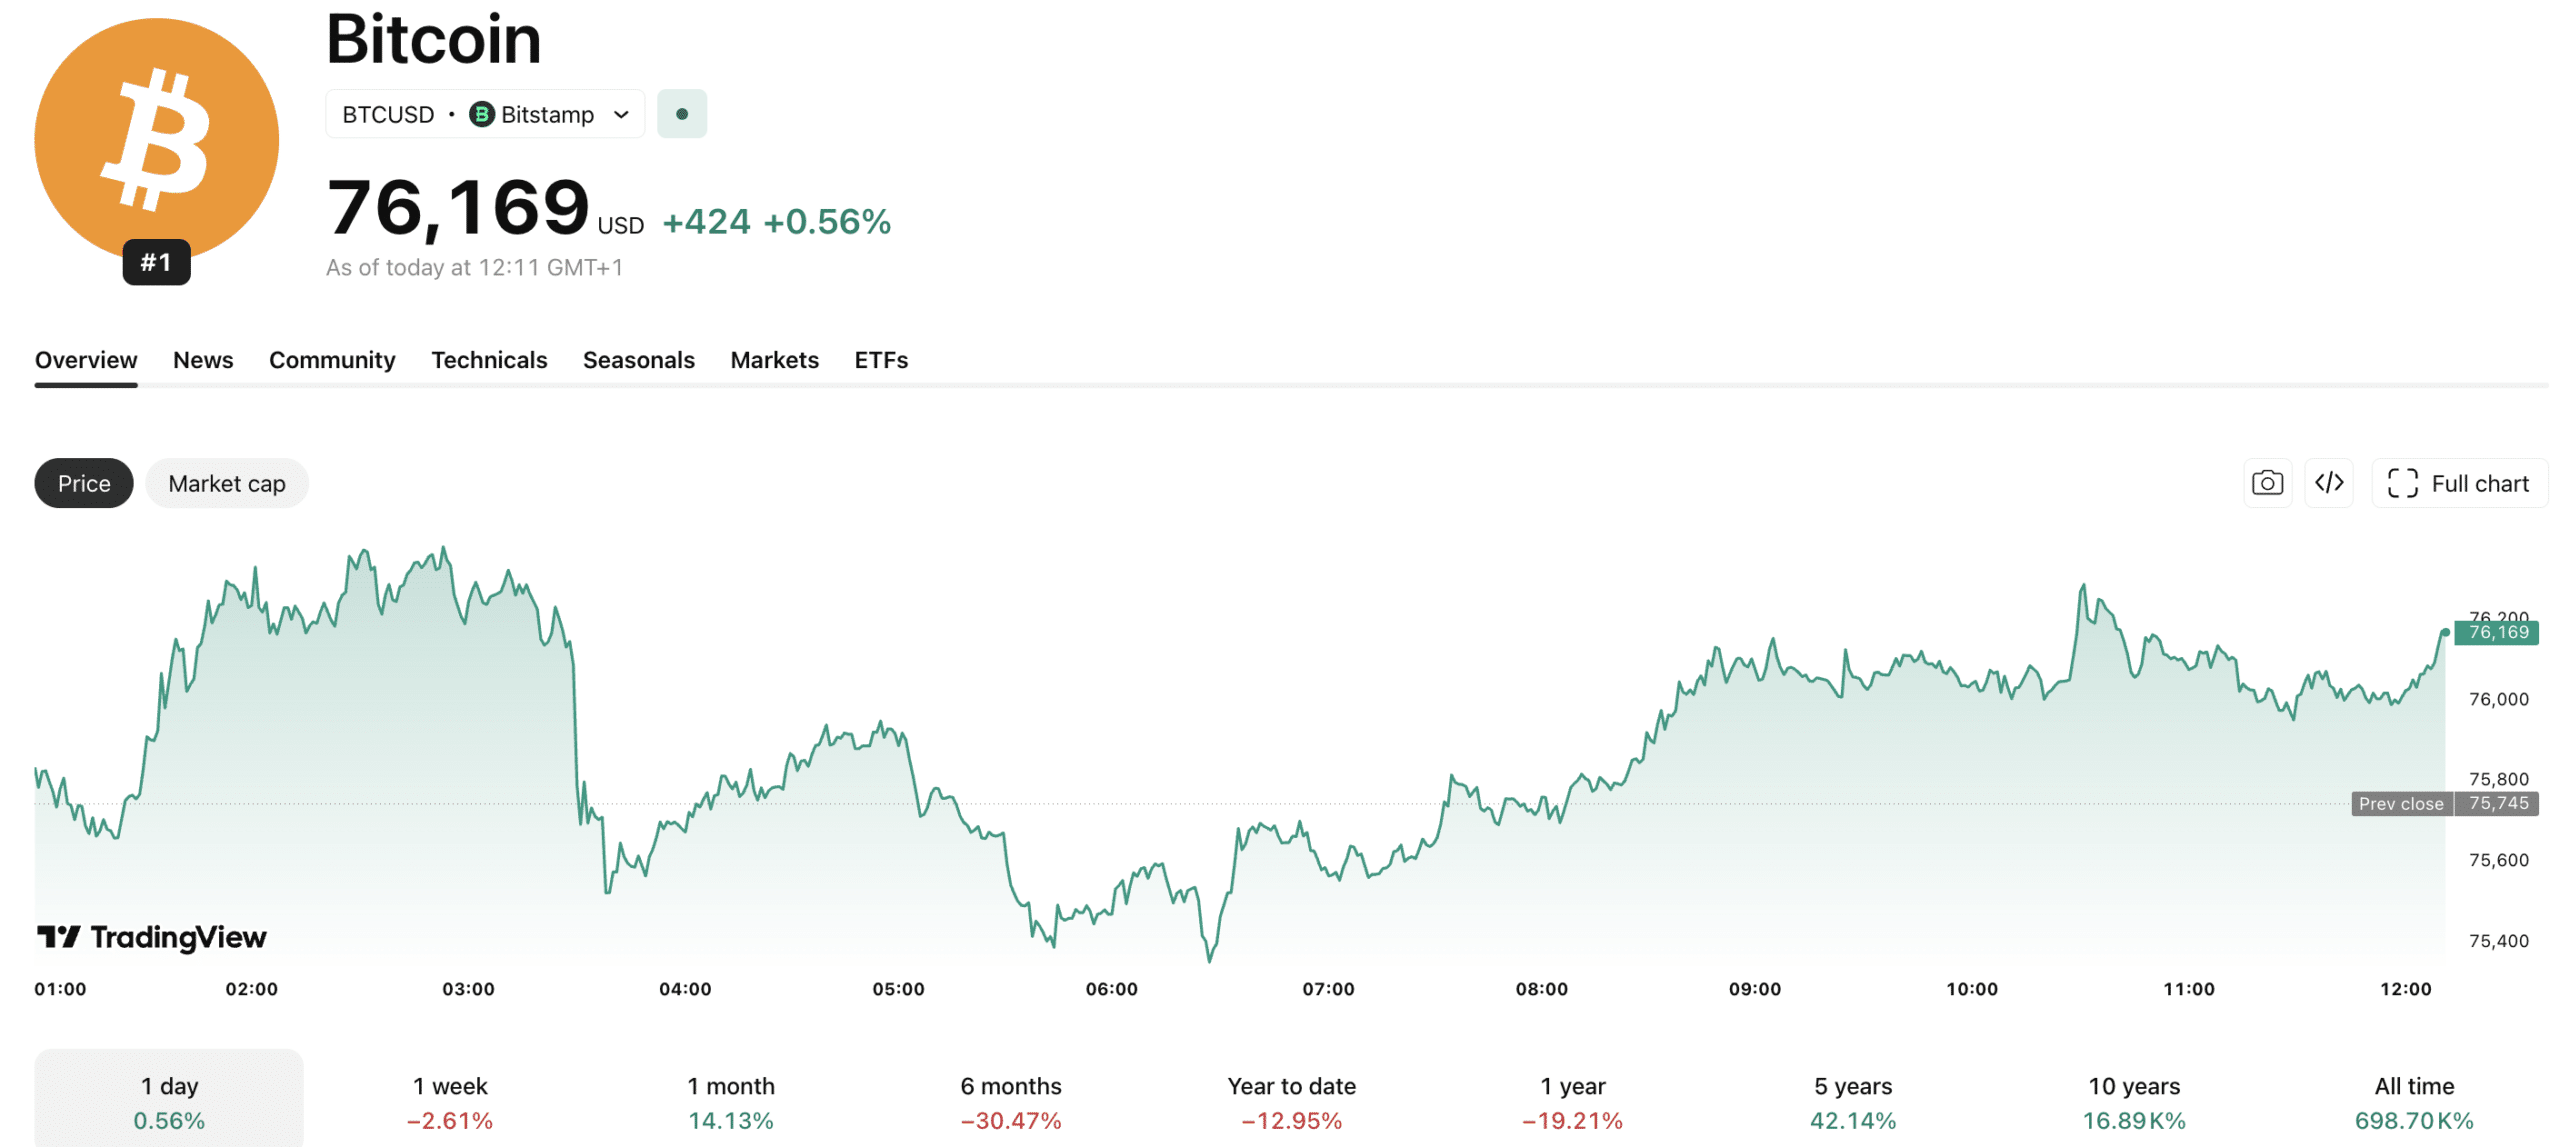
(SOURCE: TradingView)
DISCOVER: How the Powell FOMC decision is currently affecting the price of Bitcoin
Bitcoin Price Forecast: Can BTC USD Price Surpass $79,000 and Escape Fed-Iran Pressure?
Market Analyst Ted Pillows has identified the $79,000 to $80,000 range as the critical resistance zone that BTC must reclaim to avoid a deeper decline, warning that failure to break through this band could send prices back towards $74,000. This reduction objective is not arbitrary; it sits just below April’s monthly low of $74,500, and a confirmed breakout would put psychological support of $70,000 into play.
The Glassnode on-chain research team described Bitcoin as “trapped below the market average,” with the true market average – the average price weighted by the last movement of coins – sitting at $79,000. Being below the average in your own market is a bit like a store operating below its break-even point: technically still open, but structurally fragile.
Glassnode also reported that institutional capital has established a significant accumulation zone between $65,000 and $70,000, anchored by consistent inflows into spot Bitcoin ETFs and expanding CME open interest.
Hyblock CEO Shubh Varma offered a calmer reading, calling Wednesday’s decline “the usual post-FOMC news sell-off reaction” and noting that Bitcoin returned to pre-announcement levels within hours. He pointed to the fact that the global long-ask ratio has climbed to 0.3 – one of its highest figures – as evidence that real buying interest lies beneath the overall volatility. Cryptocurrency volatility around Fed announcements is well documented, and this episode follows the pattern.
$BTC macro view
Here is the table now that the first trimester has passed. The plethora of bullish confluences did not give the strong reaction I expected as we entered a bear market on Bitcoin. It’s quite simple if you understand the different layers of market structure. When we… pic.twitter.com/YCW1vg3BYU
– LavaXBT (@lava_xbt) April 30, 2026

Three paths for Bitcoin to watch
The three scenarios worth keeping in mind right now:
- Case of the bull: BTC recovers between $79,000 and $80,000 over the next week, confirms it as support, and the Iran crisis eases enough to push oil back $100 per barrel – risk appetite returns and BTC targets $84,000.
- Base case: BTC consolidates in the $74,000-$78,000 range through the monthly close, without a clean break or decisive breakout – choppy, headline-driven trading continues.
- Bear case: BTC fails to reclaim $79,000, the Iran crisis deepens, the Fed signals it won’t cut rates until 2026 (the odds have already fallen to 44% after Wednesday’s decision), and Bitcoin tests the $65,000-70,000 institutional accumulation zone.
For context on direct impact on Iran-Hormuz The situation has had an impact on the price development of Bitcoin, the geopolitical risk premium embedded in BTC at present is real and measurable. BTC support levels between $73,000 and $75,000 were tested twice recently without confirming a double bottom, this is a trend worth monitoring at the monthly close.
EXPLORE: Best Crypto Presales with Staking Rewards
Follow 99Bitcoins on XYouTube and Telegram for more crypto news and analysis.
The article Bitcoin Price Forecast: BTC USD Dips Below $76,000 – Is the “Fed-Iran” Double Whammy a Buying Opportunity? appeared first on 99Bitcoins.


