


Join our Telegram channel to stay up to date with the latest news
The price of Bitcoin edged up 1.3% over the past 24 hours to trade at $93,634 as of 1:03 a.m. EST, on trading volume that jumped 30% to $50.3 billion.
As BTC approaches the $94,000 resistance, portfolio manager Bill Miller IV says Bitcoin is poised to reach new highs in 2026.
According to Miller, “The technicals are really starting to line up, and it looks like it’s ready to go again. Personally, I expect it to peak higher than its all-time high from the fall.”
This comes as Santiment data shows that Whales and Sharks (cohort holding between 10 and 10,000 BTC) have collectively accumulated an additional 56,227 BTC worth over $5.3 billion.
📊 Crypto markets generally follow the path of major stakeholders of whales and sharks and move in the opposite direction of small retail wallets. In our table below:
🟥 Whale dumping, retail hoarding (VERY BEARISH)
🟧 Whale dumping, unpredictable retail (BEARISH)
🟨 Whales and retail… pic.twitter.com/yoC0H1keBT–Santiment (@santimentfeed) January 5, 2026
“This marks the crypto’s local bottom. And even though markets have remained relatively stable, the bullish divergence from their accumulation was expected to produce at least a minor breakout,” Santiment added.
At the same time, retail traders continued to make profits, creating bullish market conditions as long-term holders increase their reserves.
Can the price of Bitcoin continue to soar?
Bitcoin price breaks key support – poised for continued rally
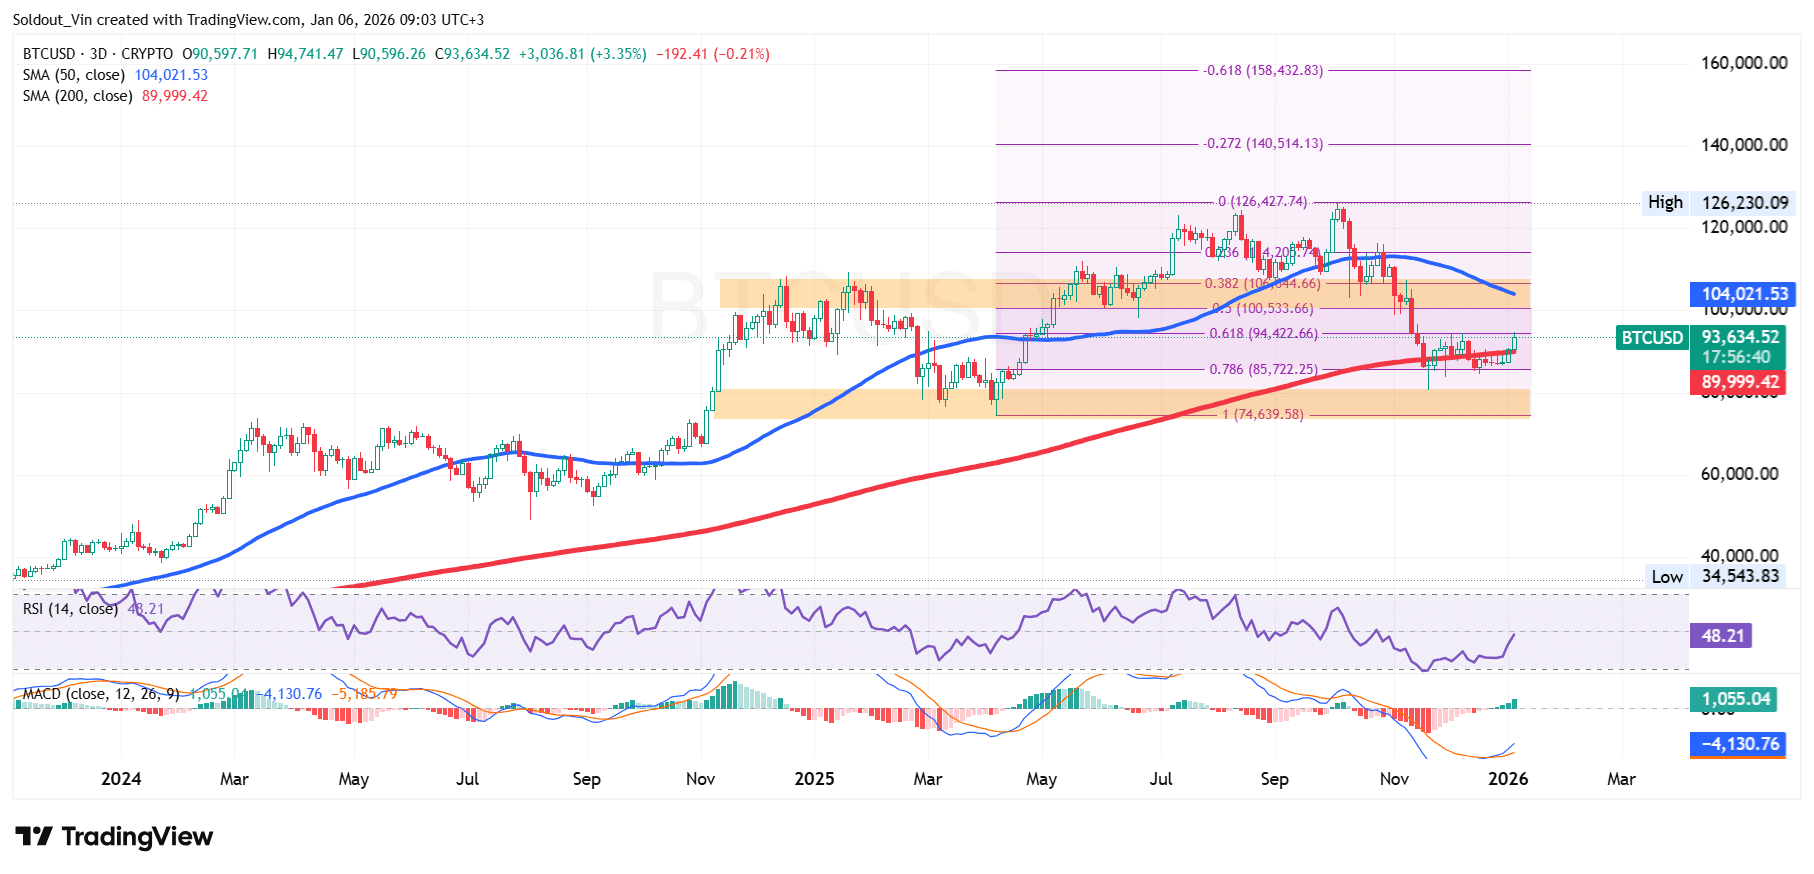
THE BTC Price has now surpassed the 200-day SMA ($89,999), which has consistently acted as a barrier for the bulls since November 2025 and a major demand area at the 0.786 Fibonacci retracement level ($85,722).
After hitting an all-time high (ATH) around $126,230 in October, Bitcoin then underwent a sustained correction, breaking key support levels in the Fibonacci retracement chart.
However, the $85,722 level provided strong support, allowing BTC to move above $90,000. This now puts the bulls on notice as they aim for a close above the 0.618 Fibonacci level at $94,422, but they are still capped below the psychological resistance at $100,533.
The 50-day SMA remains above BTC at $104,021, indicating that the price is still bearish in the short term but is held back by the 200-day SMA, suggesting a bullish scenario in the long term.
Meanwhile, buyers are now in control of the trend, with the Relative Strength Index (RSI) climbing towards the mid-50 level, currently at 48.21, up from 46 24 hours ago.
The Moving Average Convergence Divergence (MACD) also supports a bullish crossover, with the blue MACD line now moving above the signal line. However, investors should exercise caution as the MACD lines are still trading below the neutral line on a 3-day time frame.
BTC Price Outlook
According to BTC/USD chart analysis, BTC price is poised to rebound, provided it closes above the 0.618 Fib level at $94,422.
If this surge continues and the bulls apply more pressure, the next key long-term resistance is $100,000, as predicted by Bill Miller.
Further pressure could drive Bitcoin price towards the 200-day SMA as they target the key resistance zone at the 0.236 Fib zone at $114,205 and the previous supply zone.
Conversely, if the price declines to continue consolidating within the $85,000 range, the bears have the opportunity to act accordingly. Additionally, following the recent surge from this support zone, sellers can still trade their gains, exerting bearish pressure.
If a decline occurs here, the next support area is April support around $74,639.
Related news:
Best Wallet – Diversify your crypto portfolio

- Easy-to-use, feature-driven crypto wallet
- Get Early Access to Upcoming Token ICOs
- Multi-chain, multi-wallet, non-custodial
- Now on App Store, Google Play
- Stake to win a $BEST native token
- More than 250,000 active users per month
Join our Telegram channel to stay up to date with the latest news