


Join our Telegram channel to stay up to date with the latest news
The price of Bitcoin edged up more than 3% in the past 24 hours to trade at $115,557 as of 3:59 a.m. EST on trading volume that soared 173% to $59.6 billion.
This increase in BTC price above $115,000 resulted in $500 million in liquidations, according to coin mechanism.
The gathering came after U.S. Secretary Bessent hinted at a potential deal between the United States and China, which could be announced later this week after the two countries’ presidents meet in Asia.
BREAKING: US Treasury Secretary Bessent says China is “ready” to strike a trade deal with the US after 2 days of negotiations.
Bessent says the deal will remove President Trump’s 100% tariffs set to take effect on November 1.
– Kobeissi Letter (@KobeissiLetter) October 26, 2025
U.S. President Trump and China’s leader
However, some traders are betting against the price of BTC. One trader, James Wynn, claimed 1,854 USDX in referral rewards and opened a 40X short position on 0.96 BTC ($111,000). It would be liquidated if the price of BTC exceeded $117,460, according to an article Lookonchain.
Bitcoin price recovers in an ascending channel
THE BTC Price has seen a sustained rally since mid-April, trading in a bullish ascending channel pattern.
The recent rally saw Bitcoin price surge to a new all-time high (ATH) of $126,080 in October, after facing resistance around the $111,170 and $123,410 levels.
After touching the ATH, BTC price underwent a correction, falling below the $105,000 level, briefly touching this level as bulls took control of the price.
The bulls have now staged a rally to bring the price of the asset back into the ascending channel pattern.
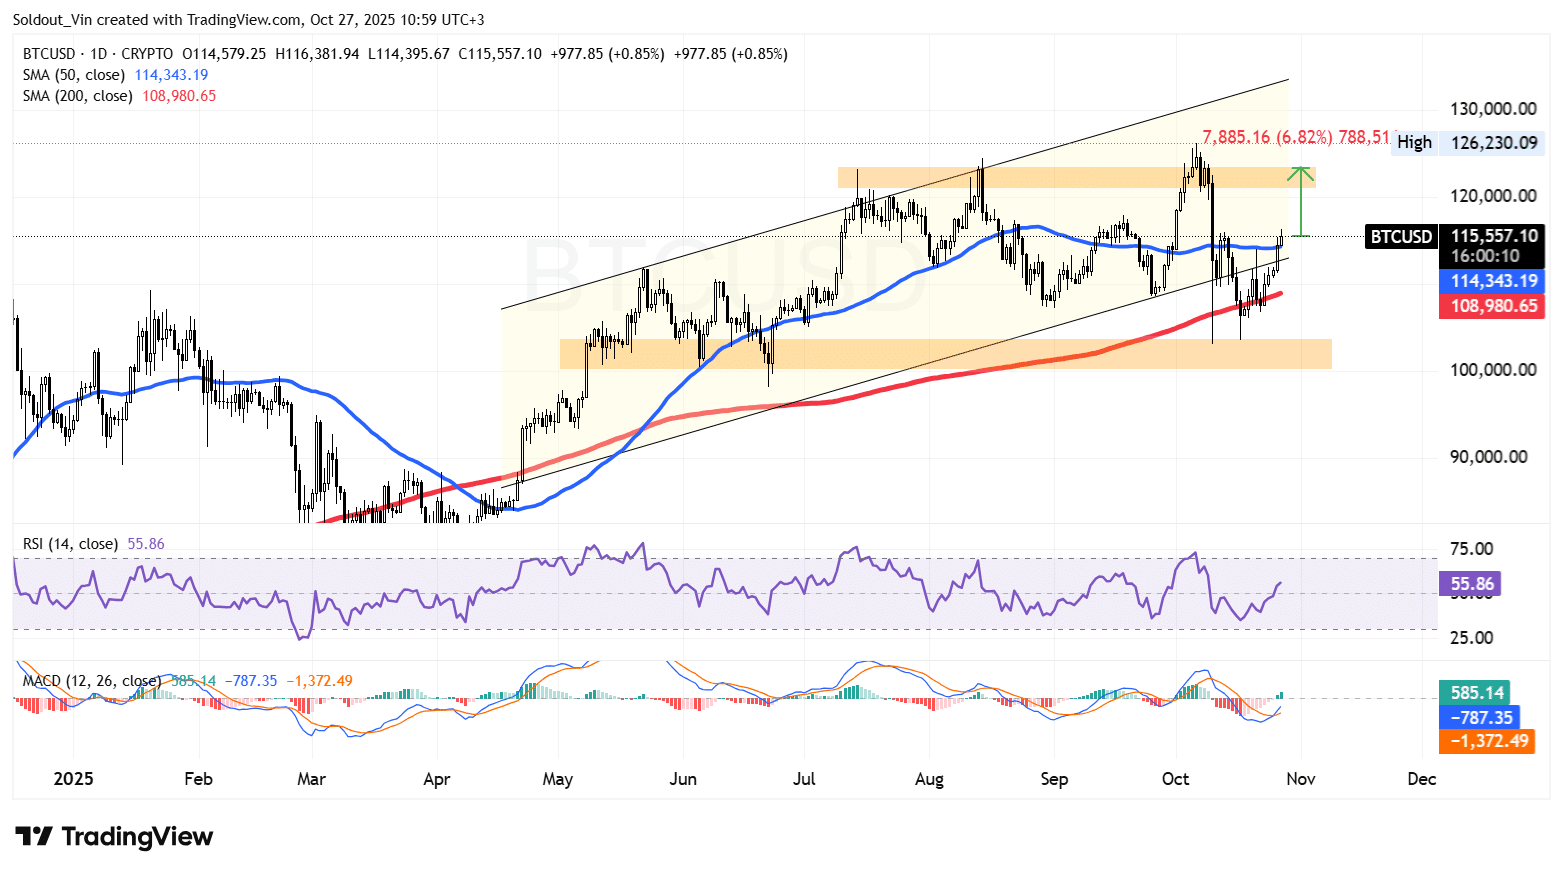
Following the gradual recovery within the 1-day chart, Bitcoin price has now moved above the 50-day and 200-day simple moving averages (SMA).
Meanwhile, relative strength has risen above the mid-50 level, currently at 55, indicating that buyers are taking control and could drive the price even higher.
The Moving Average Convergence Divergence (MACD) has also turned bullish, with the blue MACD line moving above the orange signal line, further supporting the overall bullish sentiment.
BTC bulls aim for 6% rise
Based on the current BTC/USD daily chart, Bitcoin appears poised for a bullish continuation towards the upper boundary of its ascending channel pattern.
As BTC price action recently rebounded from the 200-day SMA (around $108,980) and surpassed the 50-day SMA ($114,343), momentum is turning positive.
The next significant resistance lies at the $123,000 level, up 6.82% from the current level, with a potential upside target near the previous channel high around $126,000.
If Bitcoin maintains its position above the 50-day SMA, a move towards $126,000 in the coming weeks is likely.
Conversely, failing to sustain the price above $114,000 could trigger a short-term pullback towards $110,000. Overall, the chart structure and technical indicators support a bullish medium-term projection, targeting around $125,000 to $126,000 as the next major price zone.
Related news:
Best Wallet – Diversify your crypto portfolio

- Easy-to-use, feature-driven crypto wallet
- Get Early Access to Upcoming Token ICOs
- Multi-chain, multi-wallet, non-custodial
- Now on App Store, Google Play
- Stake to win a $BEST native token
- More than 250,000 active users per month
Join our Telegram channel to stay up to date with the latest news