




Close Menu
Altcoin ObserverAltcoin Observer
  • Regulation
  • Bitcoin
  • Altcoins
  • Market
  • Analysis
  • DeFi
  • Security
  • Ethereum
Categories
  • Altcoins (3,732)
  • Analysis (3,840)
  • Bitcoin (4,470)
  • Blockchain (2,157)
  • DeFi (2,623)
  • Ethereum (2,773)
  • Event (119)
  • Exclusive Deep Dive (1)
  • Landscape Ads (2)
  • Market (2,714)
  • Press Releases (12)
  • Reddit (2,847)
  • Regulation (2,474)
  • Security (4,103)
  • Thought Leadership (3)
  • Videos (44)
Hand picked
  • Uniswap RFC explores running private exchanges using v4 and UniswapX hooks
  • Australia targets Telegram a day after Russia indicts Durov
  • Bitcoin’s weak hands fold
  • Success Story: Jonathan Nichols’ Learning Journey with 101 Blockchains
  • Kraken Cyprus honored at the 14th Invest Cyprus International Investment Awards
We are social
  • Facebook
  • Twitter
  • Instagram
  • YouTube
Facebook X (Twitter) Instagram
  • About us
  • Disclaimer
  • Terms of service
  • Privacy policy
  • Contact us
Facebook X (Twitter) Instagram YouTube LinkedIn
Altcoin ObserverAltcoin Observer
  • Regulation
  • Bitcoin
  • Altcoins
  • Market
  • Analysis
  • DeFi
  • Security
  • Ethereum
Events
Altcoin ObserverAltcoin Observer
Home»Analysis»ETH price tests $4,100 support after double bottom forms
Analysis

ETH price tests $4,100 support after double bottom forms

October 28, 2025No Comments
Share Facebook Twitter Pinterest LinkedIn Tumblr Reddit Telegram Email
Share
Facebook Twitter LinkedIn Pinterest Email


ETH price is testing a crucial support level after creating a bullish reversal trend. Could a rebound from here put it back on track for a strong upward move?

Summary

  • ETH price is testing the $4,100 support level after falling from its high on Monday.
  • A double bottom pattern has formed on the 4-hour chart.
  • Technical indicators signaled the first signs of a reversal.

After rebounding 10% to a weekly high of $4,232 on Monday, Ethereum (ETH) retreated as profit-taking began, closing in on psychological support at $4,100, a level it must hold to avoid deeper losses.

Ethereum’s collapse follows after forming a double bottom pattern on the 4-hour chart, a pattern that often leads to a reversal of an uptrend. In the case of Ethereum, the two trend lows formed near the $3,713 level, with a neckline coming in around $4,100, which now acts as a key resistance zone.

ETH price formed a bullish reversal trend on the 4-hour chart.
ETH price formed a bullish reversal trend on the 4-hour chart – October 28 | Source: crypto.news

A breakout of this type of structure can lead to a lasting trend reversal for several days. For Ethereum, a confirmed move above the neckline opens the door for a rally towards $4,491, up 10% from current levels. The target is calculated by adding the depth of the double bottom formed at the escape point.

Some caution is required, however, with momentum indicators sending mixed signals. The MACD line appears to be approaching a bearish crossover with the signal line, while the RSI has formed a bearish divergence. These two signs indicate that the bullish momentum could fade in the short term.

For now, $4,100 is the immediate resistance zone, while downside support lies near $4,000, a psychological level that Ethereum must maintain if it wants to stay on its upward trajectory.

According to CoinGlass’ 24-hour liquidation heatmap, a notable group of short liquidations are visible between $4,100 and $4,200, aligning with the neckline of the double bottom pattern and the upper boundary of the falling wedge identified earlier.
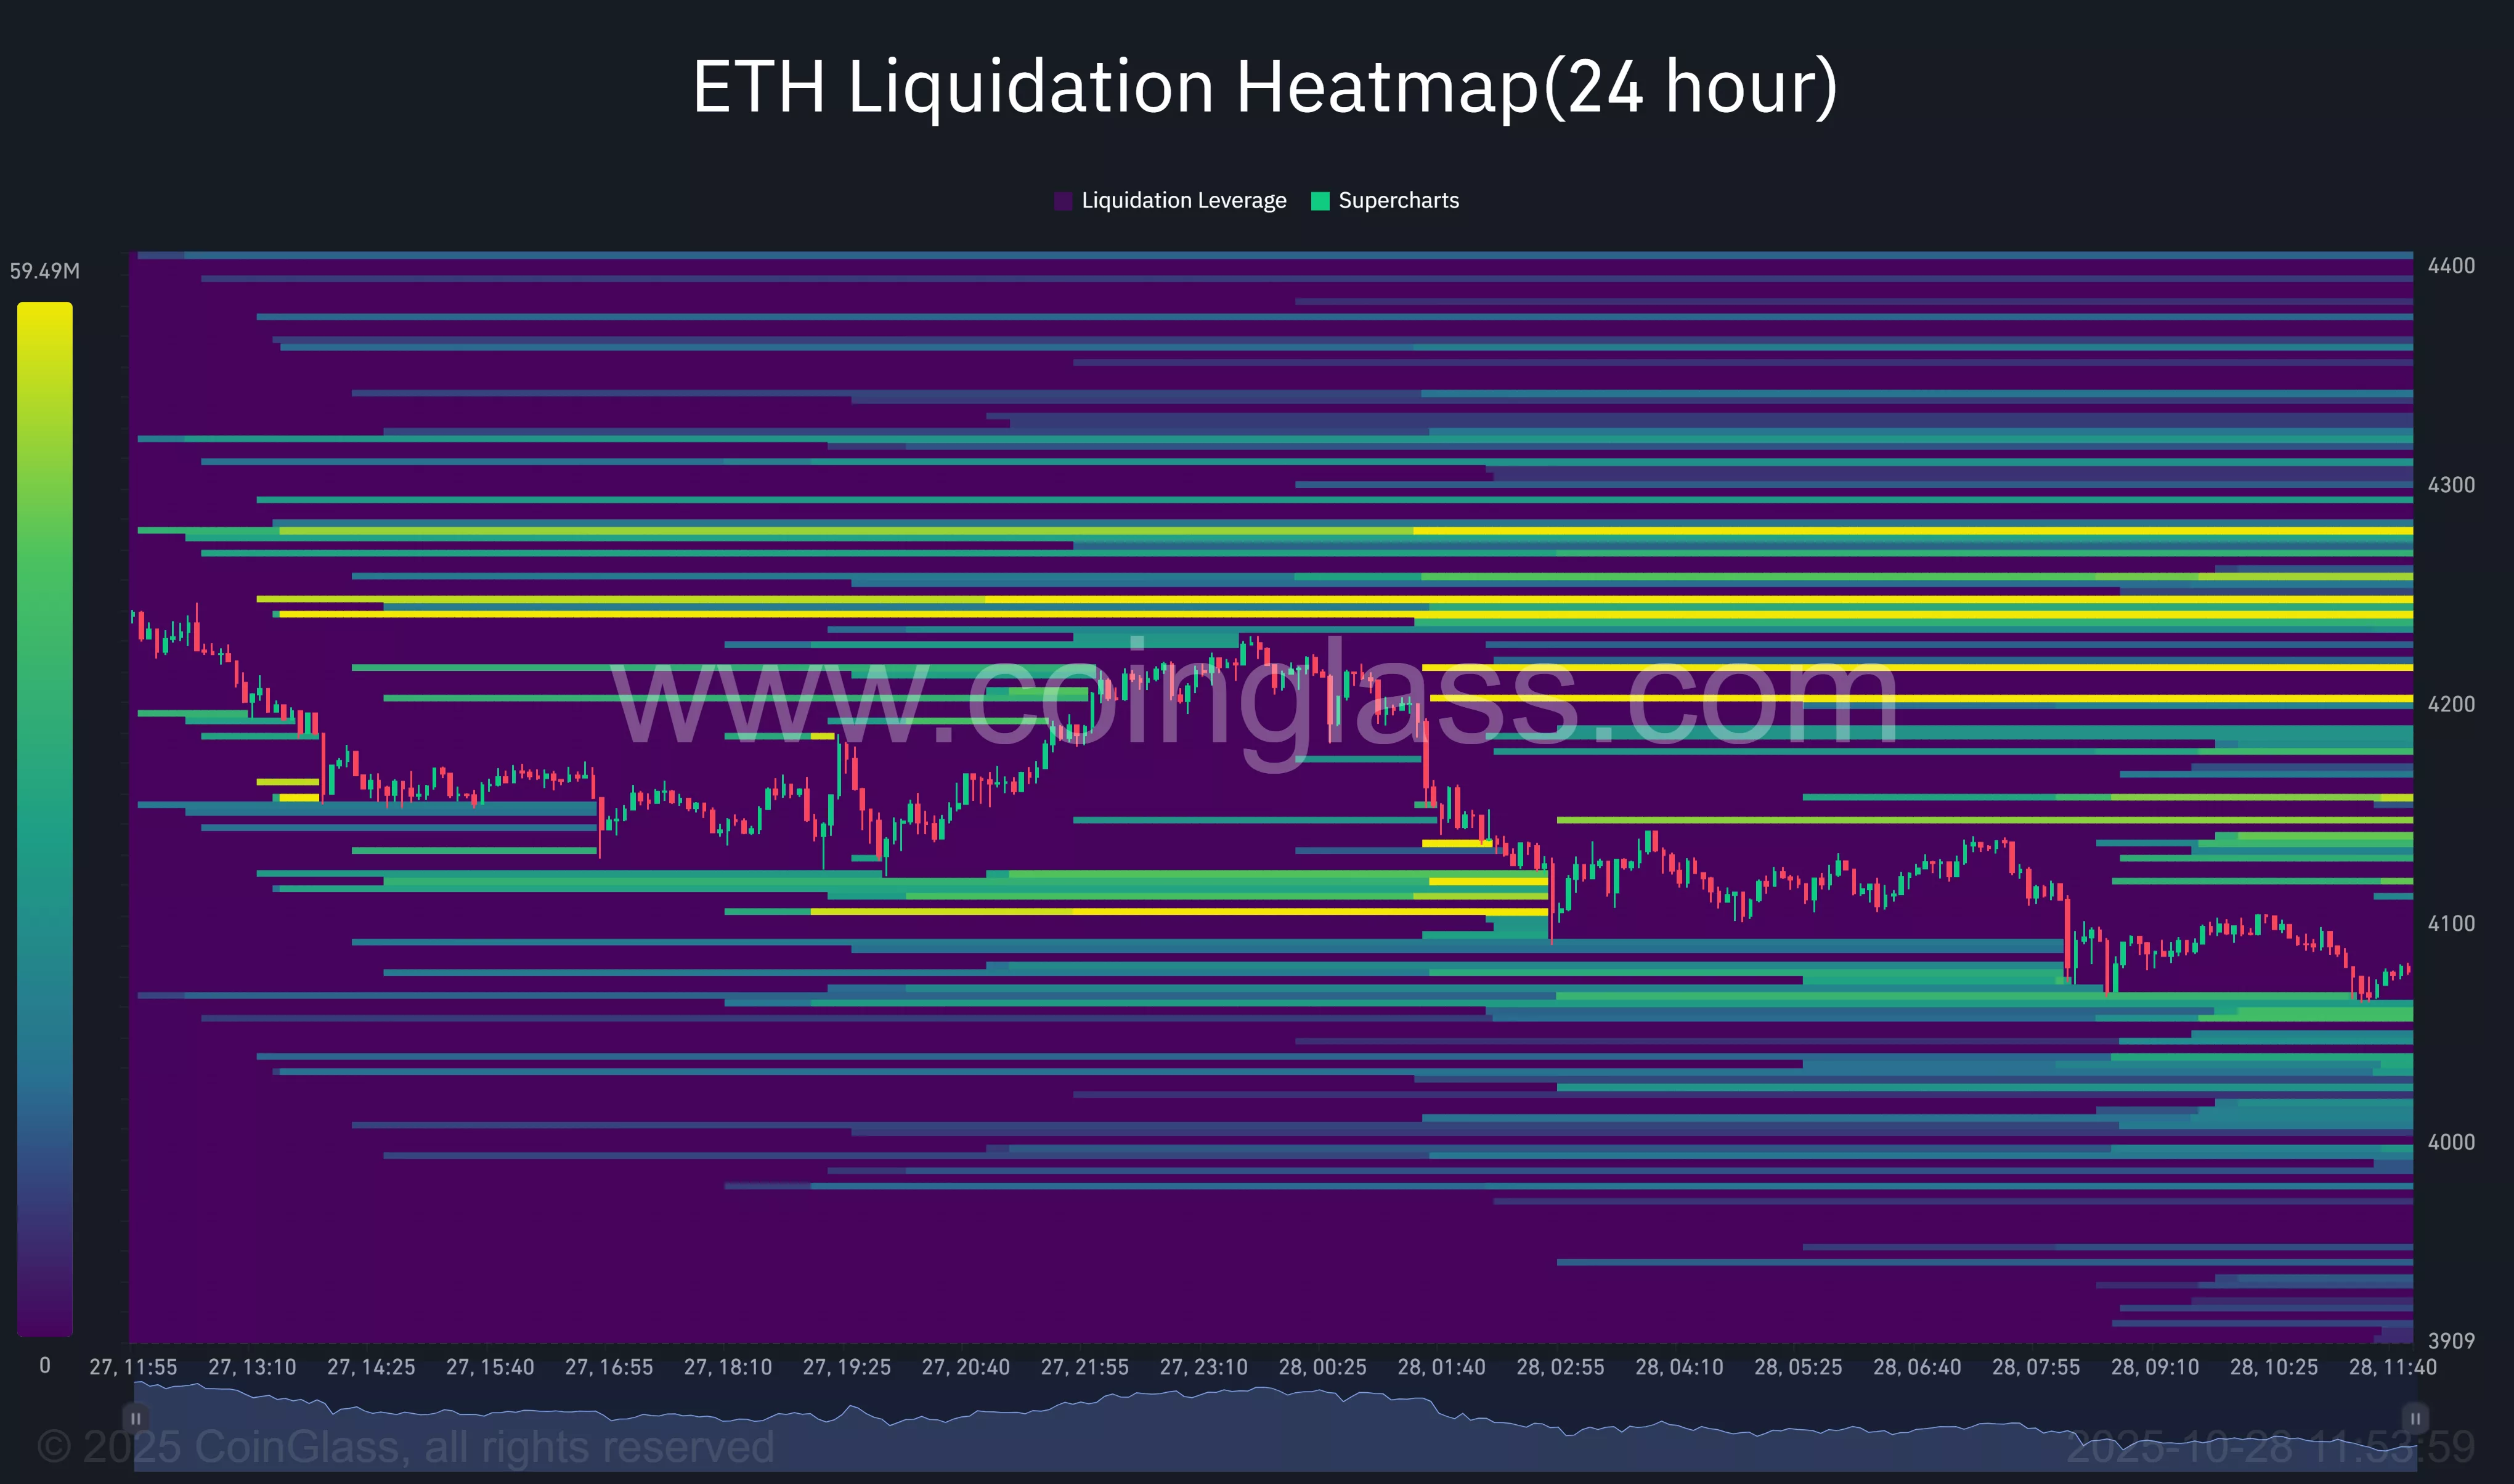
The ETH liquidation heatmap shows a squeeze risk above $4,100, with weak support below $3,900.
Source: CoinGlass

A sharp break above this band could trigger a short squeeze, forcing the liquidation of overleveraged positions and accelerating the price rally. With so much liquidity piled up in this zone, bulls could find the momentum needed to push ETH towards the $4,400-$4,500 target range.

In contrast, the heat map shows considerable liquidation interest between $4,000 and $3,900, suggesting that this area could be a strong demand area in the near term.

If Ethereum dips into this region, buyers could move aggressively to defend key support. However, if ETH breaks below $3,900, the chart begins to brighten, indicating lower liquidity and limited buying interest, which could expose the token to increased volatility and larger losses, possibly driving it towards the $3,700-$3,650 region.

Disclosure: This article does not represent investment advice. The content and materials presented on this page are intended for educational purposes only.


Source link

Share. Facebook Twitter Pinterest LinkedIn Tumblr Email
Previous ArticleEthereum price jumps 7% on $81 million purchase of SharpLink Gaming
Next Article Bitcoin price up 3% thanks to US-China trade hopes

Related Posts

Analysis

Bitcoin’s weak hands fold

July 30, 2026
Analysis

CLARITY Act Delay Shows Fight Against Crypto Market Structure Is Not Over

July 30, 2026
Analysis

CLARITY Act delay risks taking US lead on crypto, lawmaker warns

July 28, 2026
Add A Comment
Leave A Reply Cancel Reply

Single Page Post
Share
  • Facebook
  • Twitter
  • Instagram
  • YouTube
Featured Content
Event

Dutch Blockchain Week 2026 strengthens position as Europe’s leading B2B blockchain event week

April 14, 2026

Amsterdam, April 2026 – Dutch Blockchain Week 2026 is rapidly evolving into one of Europe’s…

Event

Global Games Show Riyadh: The Ultimate Creator & Influencer Hub

March 31, 2026

The fast-evolving gaming ecosystem of Riyadh is powered by solid national investment, a flourishing esports…

1 2 3 … 82 Next
  • Facebook
  • Twitter
  • Instagram
  • YouTube

Australia targets Telegram a day after Russia indicts Durov

July 30, 2026

Ethena whales withdraw 102 million tokens from exchanges: has ENA selling pressure eased?

July 30, 2026

Audiera loses KEY support – can BEAT recover from 24% crash?

July 29, 2026
Facebook X (Twitter) Instagram LinkedIn
  • About us
  • Disclaimer
  • Terms of service
  • Privacy policy
  • Contact us
© 2026 Altcoin Observer. all rights reserved by Tech Team.

Type above and press Enter to search. Press Esc to cancel.

bitcoin
Bitcoin (BTC) $ 62,917.00
ethereum
Ethereum (ETH) $ 1,875.30
tether
Tether (USDT) $ 0.999228
bnb
BNB (BNB) $ 601.97
usd-coin
USDC (USDC) $ 0.999583
xrp
XRP (XRP) $ 0.994013
solana
Solana (SOL) $ 74.53
tron
TRON (TRX) $ 0.33116
figure-heloc
Figure Heloc (FIGR_HELOC) $ 1.00
staked-ether
Lido Staked Ether (STETH) $ 2,265.05