




Bitcoin price fell below $70,000 for the first time since April 8, completing a roughly 1-5% decline from the $82,000-$83,000 range it represented just a few weeks ago, and thus driving the total crypto market cap below $2.5 trillion.
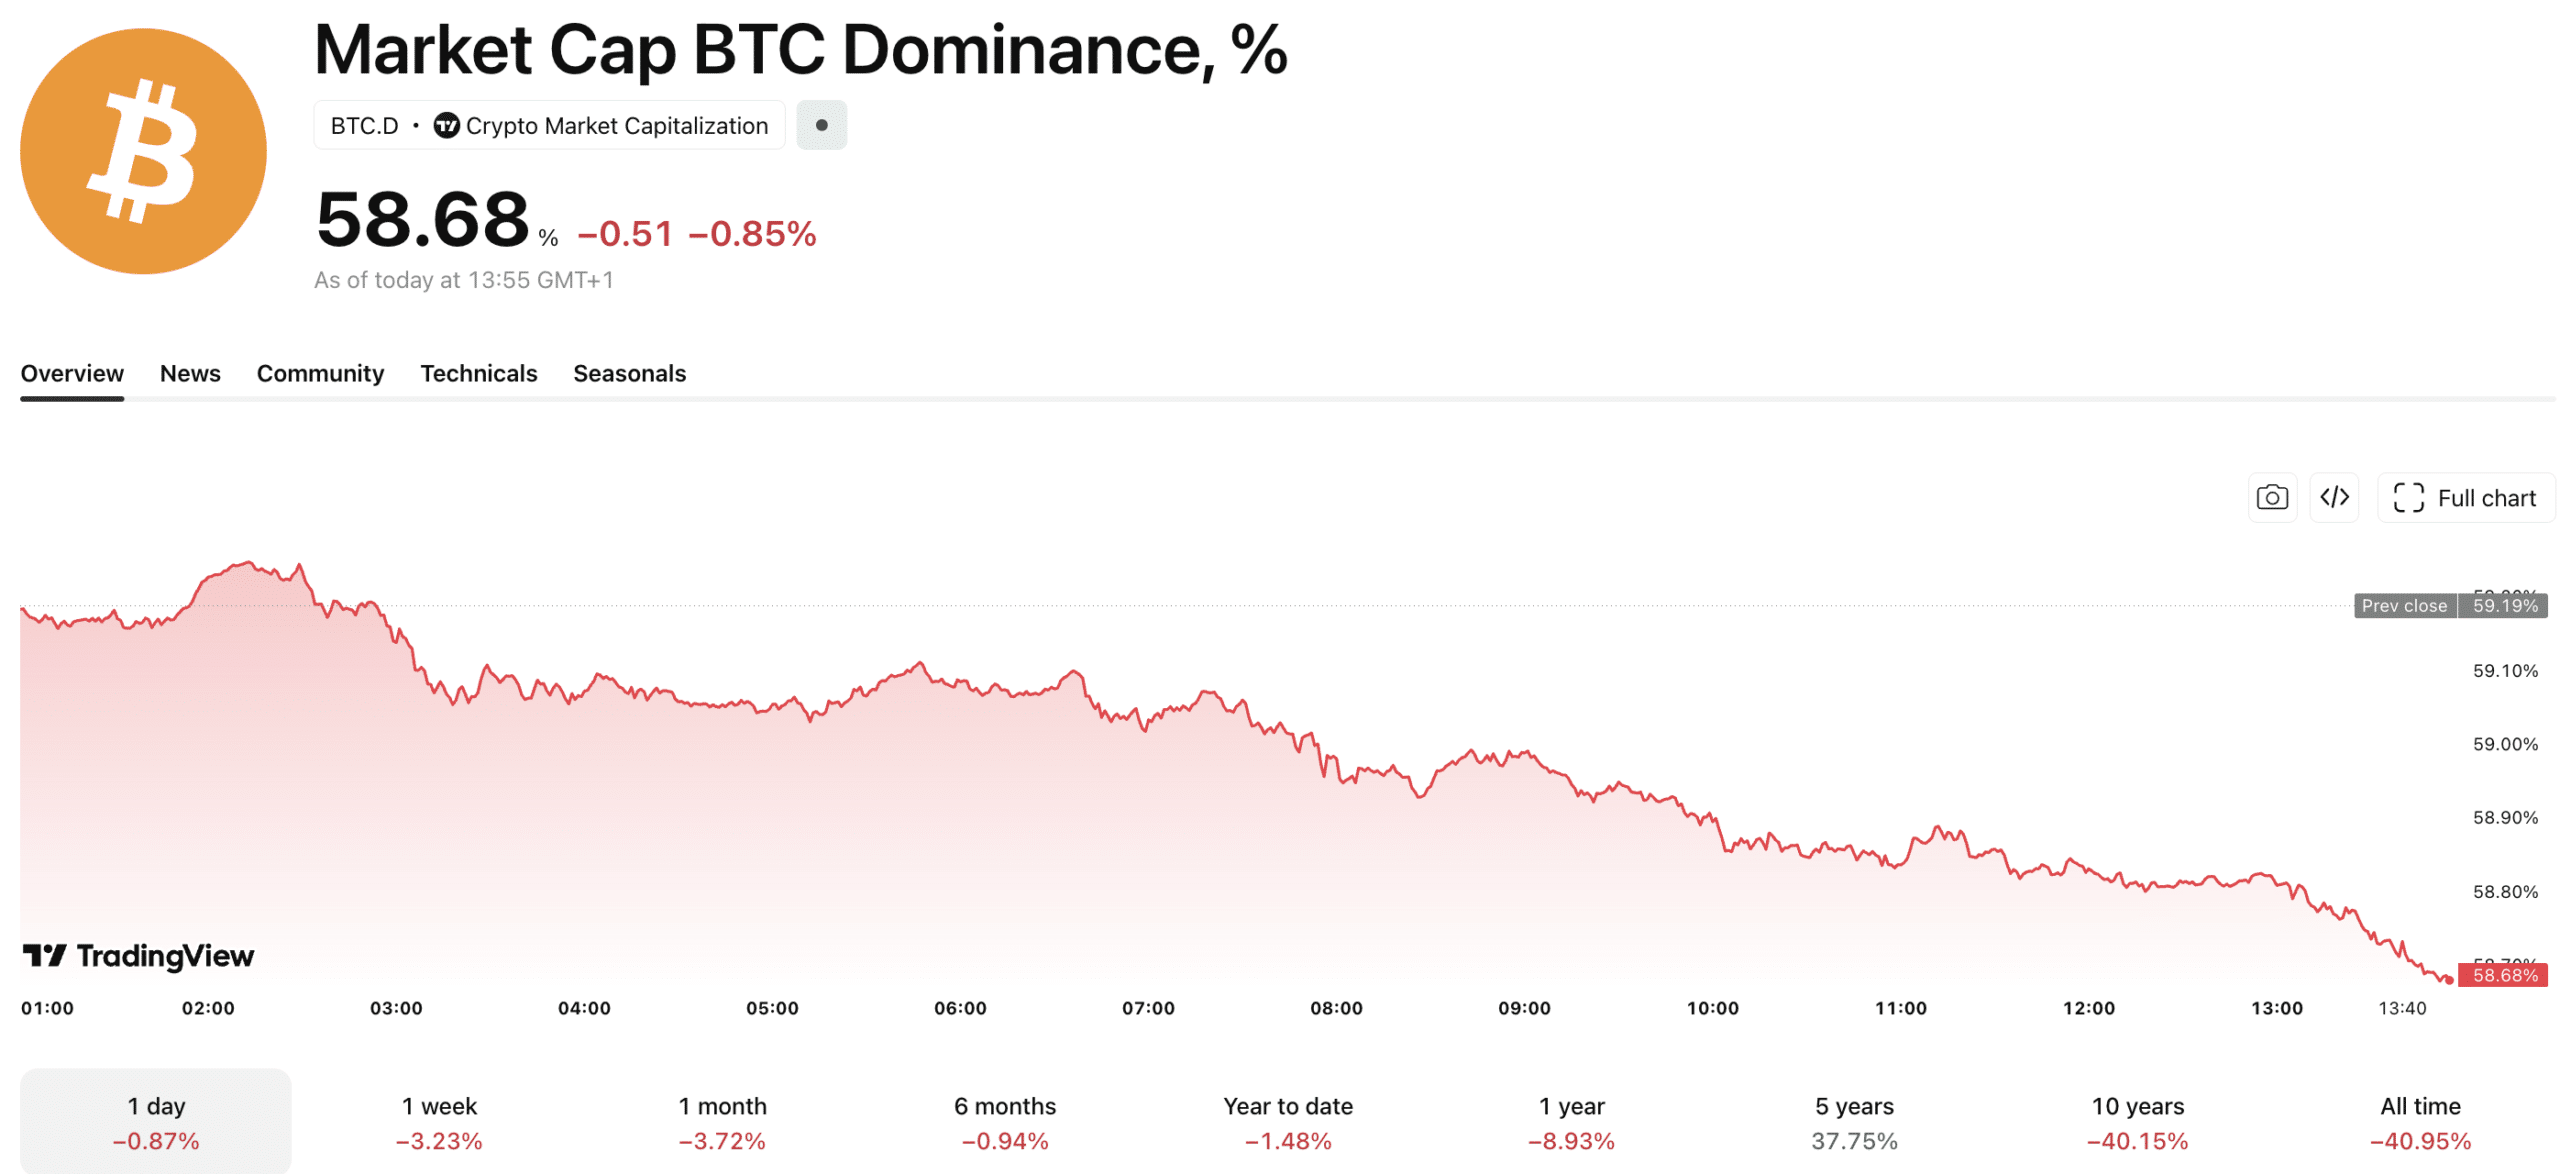
The analytical question is no longer whether this constitutes a significant market correction; the price structure justifies this in itself, but does the accompanying drop in BTC dominance to 58.7% on CoinGecko signal a tactical reallocation of capital toward altcoins or does it simply reflect a mechanical compression of correlation during a broad deleveraging event?
The complication is that both readings can be true simultaneously, and distinguishing between them requires looking beyond the headline dominance figure and what is actually driving the relative outperformance of certain altcoins at that particular point.
BTC dominance at 58.7%: structural rotation or leveraged long flush
(SOURCE TradingView)
Bitcoin’s dominance has recently declined by about two percentage points, coinciding with a decline in perpetual futures funding rates and a contraction in open interest rates, suggesting a forced deleveraging of long positions rather than a coordinated sell-off. This distinction is important because it suggests that the decline of dominance may exaggerate the actual turnover of capital.
After losing the $80,000 support level, Bitcoin fell to $75,000 around May 23-24, attempted to rebound to $78,000, and then continued to fall to the $73,000-$74,000 range. In June, it reached $71,000 before further losses pushed its market capitalization below $1.4 trillion. Mt. Gox portfolio movements have contributed to market pressure, although the exact impact remains unclear.
Currently, Bitcoin dominance stands at 58.7%, which remains significantly higher than the sub-50% levels that typically signal peak conditions. Although some traders are suggesting a potential shift from Bitcoin to altcoins, the evidence for such a transition is in its early stages, as sustained outperformance of alts requires more than temporary changes in relative losses.
DISCOVER: Best Meme Coins to Buy in 2026
Altcoin relative strength is uneven and this inequality is diagnostic
(SOURCE: CoinGlass)
As of Tuesday, the altcoin landscape appears fragmented. Ethereum remains below $2,000, while XRP, Cardano, TRON, and RAIN each fell below 3%, less than Bitcoin’s losses. BNB, Solana and HYPE are down around 1%. This indicates some resilience among large-cap assets, but does not confirm a new season.
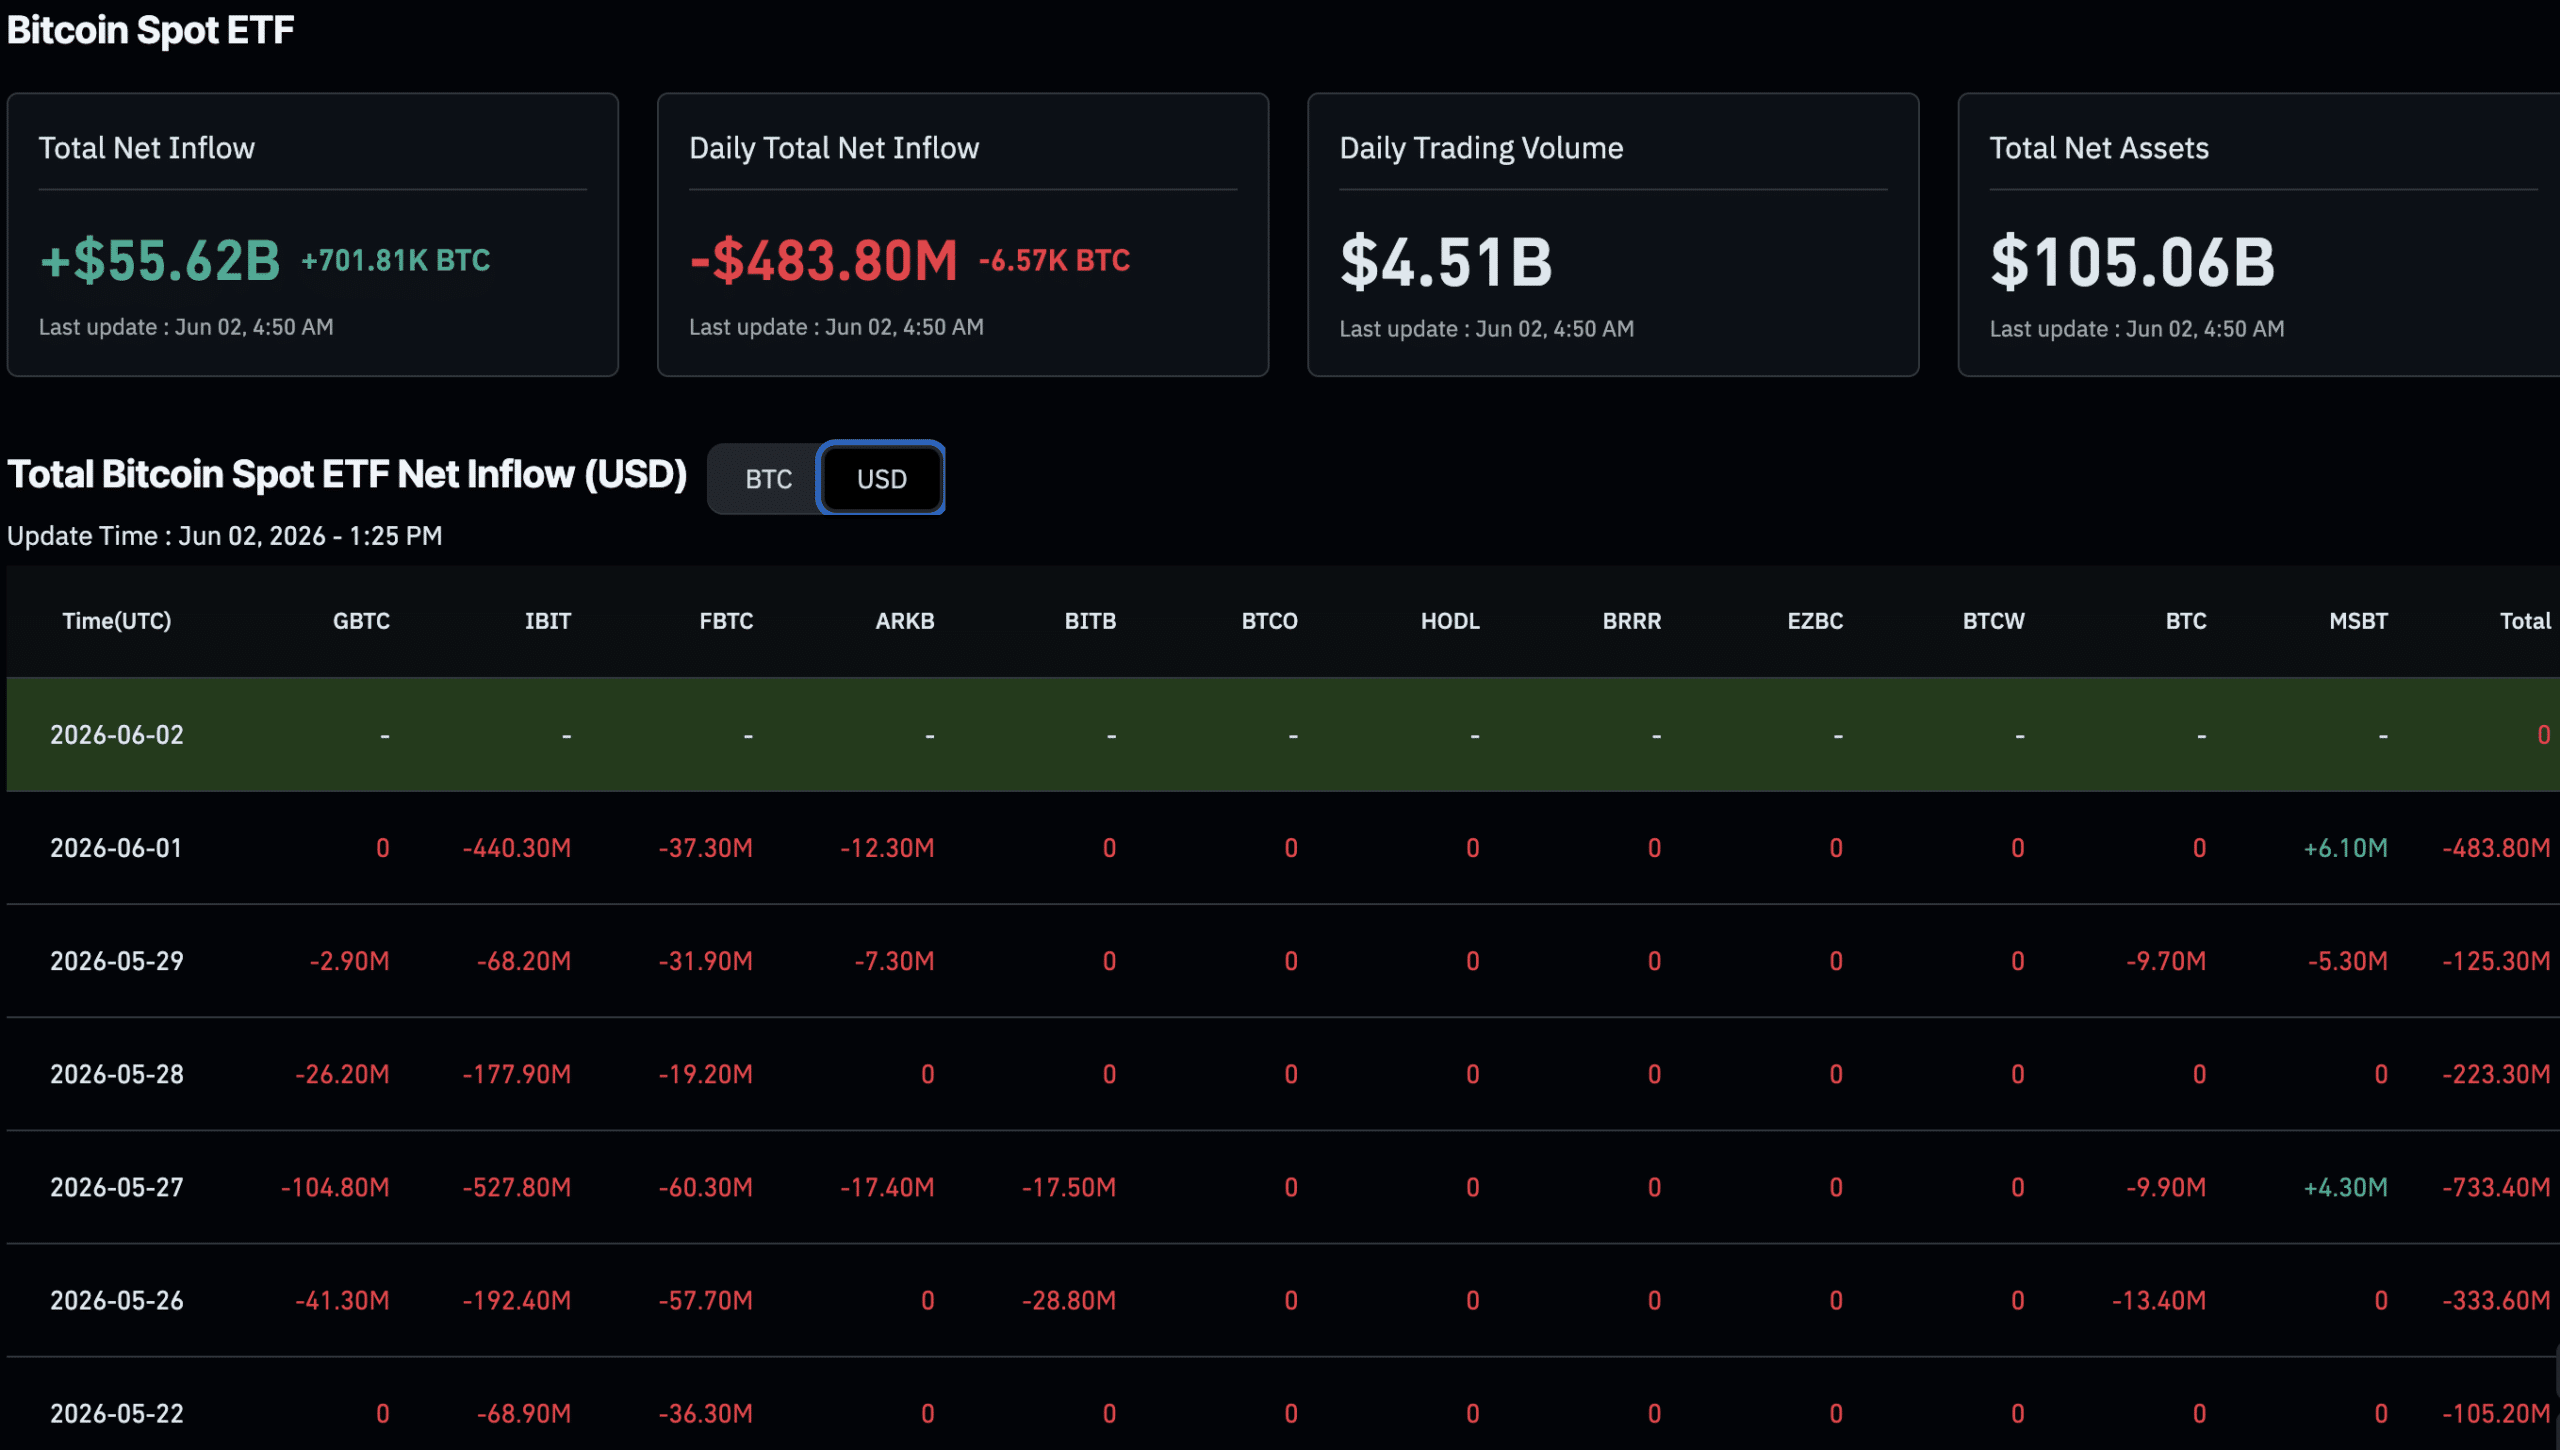
Adding to the complexity, recent data from US spot Bitcoin ETFs shows net outflows, contrasting with prior inflow patterns. Historical trends indicate that sustained outflows of over $150 million often correspond to Bitcoin highs and resulting volatility. The response from institutional buyers to the sub-$70,000 level will be crucial in determining whether the altcoin’s strength continues to follow Bitcoin.
Bitcoin Price Structure: Three Scenarios From Here
$BTC broke the previous weekly low strongly, without even a decent rebound candle, the previous month’s previous daily low all broken with a slow and significant bleed in progress.
Now, either today’s daily candle constitutes a long wick if it closes above $70.6k the day before… pic.twitter.com/EGoXwkvnNk
— Zord (@ZordXBT) June 2, 2026
From a technical analysis perspective, Bitcoin’s decline below $70,000 removes a key psychological support level, potentially leading to previous demand zones between $60,000 and above. Analysts noted that a loss of $70,000 could mean a move towards $60,000 – $55,000, given the lack of significant on-chain accumulation between $70,000 and $74,000.
Case of the bull: If Bitcoin price rallies and closes above $70,000-72,000 on significant volume, likely due to positive ETF flows or macroeconomic catalysts, it could lead to a retest of $74,000-75,000.
Base case: Bitcoin could consolidate in the $65,000-$70,000 range, with BTC dominance stabilizing around 55-57%. This scenario would imply that the market digests forced liquidations without massive sales, but would not confirm a sustained rotation of altcoins.
Bear case: Failure to recover $70,000 quickly, coupled with continued ETF outflows and negative macroeconomic sentiment, could lead to targets of $65,000 and then $60,000 to $55,000. In this case, altcoin strength could be short-lived and BTC dominance could increase as altcoin liquidity decreases. A daily close below $68,000 would invalidate bullish hopes.
DISCOVER: Best Meme Pieces to Buy for June
following
Disclaimer: Coinspeaker is committed to providing unbiased and transparent reporting. This article is intended to provide accurate and current information, but should not be considered financial or investment advice. Because market conditions can change quickly, we encourage you to verify the information for yourself and consult a professional before making any decisions based on this content.

Neil is a professional cryptocurrency content writer with years of experience. He has written for various cryptocurrency websites to report on the latest news and has been hired by all kinds of cryptocurrency projects, to create content that would increase their visibility and attract more potential investors.
Neil Mathew on LinkedIn


