




The price of BTC in USD fell to $79,200, down 2.3% over 24 hours, after Chinese President Xi Jinping warned Donald Trump of a potential “collision, even clashes” over Taiwan during their summit in Beijing, the first visit to China by a sitting US president in almost a decade.
The move topped Bitcoin’s $80,000 low that had held for most of last week and added to two consecutive rising inflation figures that have significantly complicated the Federal Reserve’s path to rate cuts.
The analytical question is no longer whether Bitcoin can reclaim $82,000; it is a question of whether $78,000 will hold water if the second day of the summit causes a new geopolitical shock.
Spot Bitcoin ETFs saw net outflows of $630 million on Wednesday alone, the largest single-day drawdown since late January, bringing the five-session total to around $1.26 billion. This scale of institutional buying, which is accompanied by a macro band actively hostile to risky assets, constitutes the context which frames each level of support discussed below.
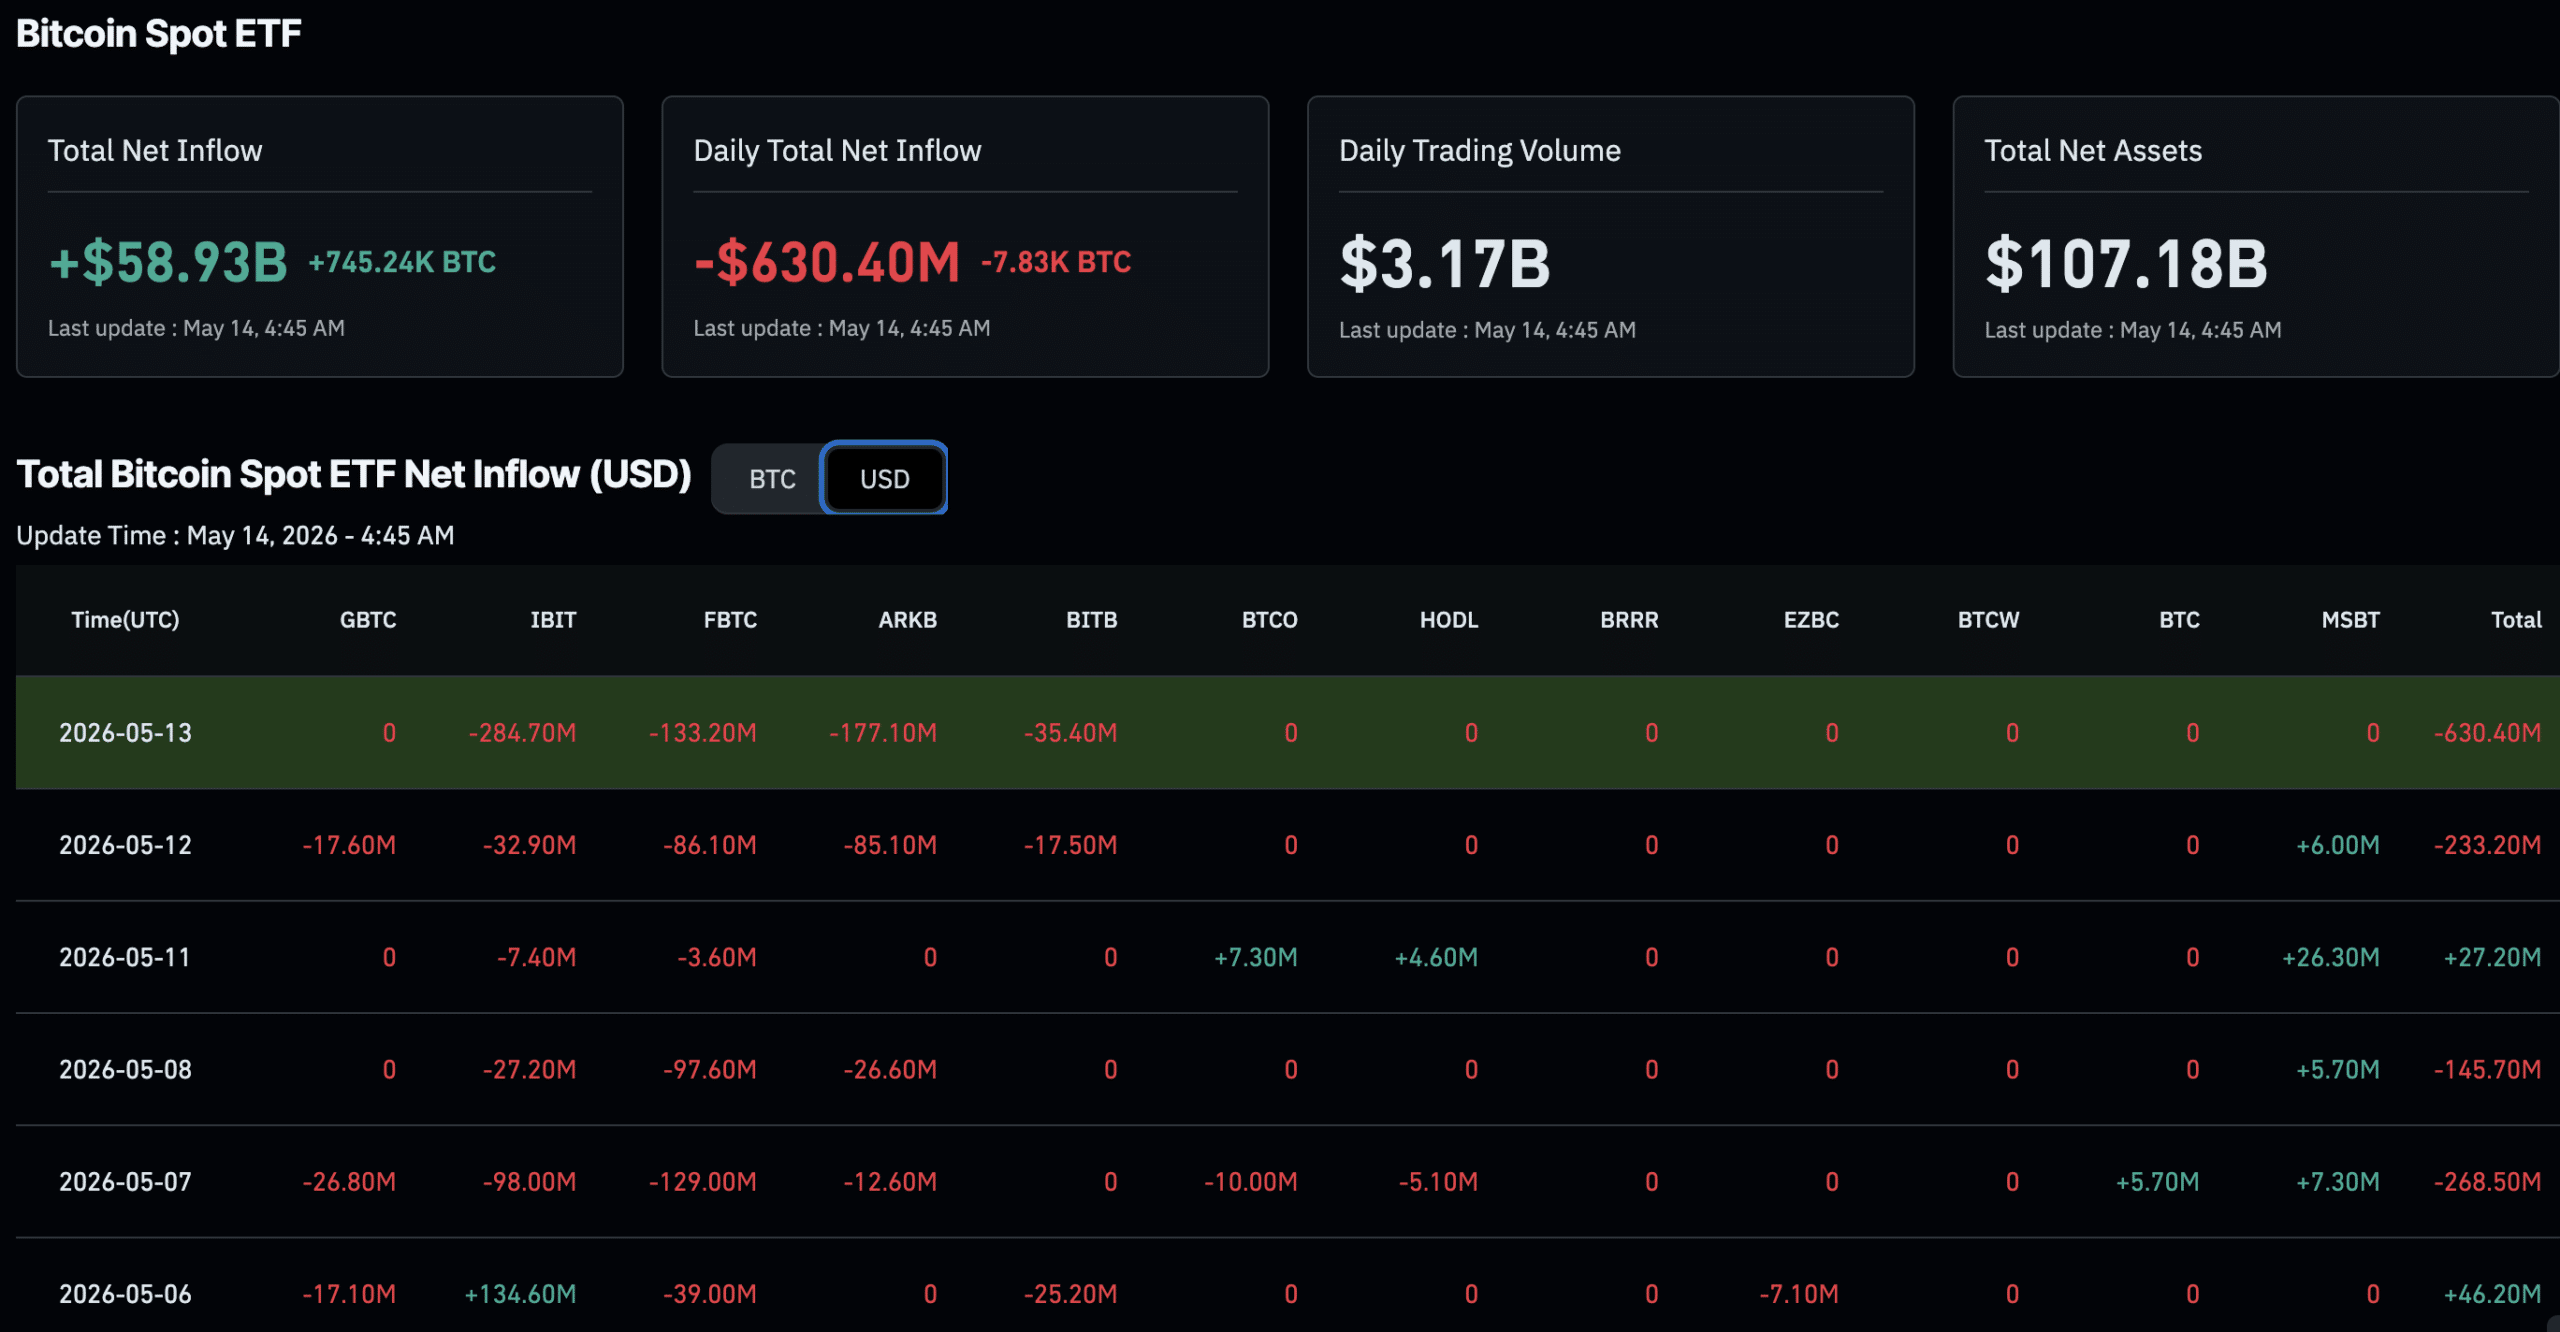
(SOURCE: CoinGlass)
BTC USD price drops to $79,200 following Xi’s Taiwan warning
The transmission mechanism is influenced by sovereign risk appetite rather than specific crypto flows. Xi’s warning of possible “collisions” over Taiwan was announced by state media ahead of a bilateral meeting, roiling Asian stock markets. The MSCI Asia Pacific Index reversed a 0.8% gain to close 0.1% lower, while mainland China stocks fell 1.3% after hitting their highest level since 2021.
This stock volatility has impacted crypto, which has recently maintained a high correlation with risk assets. Bitcoin has struggled to hold its 200-day moving average near $82,000, and past breakdowns suggest this level is influencing sentiment rather than serving solely as technical support.
Inflation data made matters worse, with the producer price index beating forecasts at 1.4% month over month, following Tuesday’s 3.8% CPI, the highest in almost three years. These inflationary surprises weaken the structural case for buyers, as noted by CoinPanel’s Kirill Kretov, who commented on the politically charged environment in which headlines quickly change sentiment.
Meanwhile, Nasdaq 100 futures rose 0.2% and Asian technology stocks rose 2.3%, supported by Cisco’s 20% after-hours rise. However, the divergence between tech stock strength and crypto weakness highlights that BTC USD’s current price woes are rooted in macro and geopolitical factors, rather than a general shift away from growth assets.
Can Bitcoin Hold $78,000 After Breaking Above $80,000 Low?
$BTC Update
Bitcoin is currently in a very important support zone after losing the short-term uptrend line. Currently, the price is trying to hold the 79.4K zone, but the structure is starting to weaken as BTC struggles to regain higher levels.
The recent movement below… pic.twitter.com/nQoCyM2LZx
– Cryptorphic (@Cryptorphic1) May 14, 2026
Bitcoin price heading into Thursday’s Asian session faces challenges, trading around $79,200 after falling below $80,000. The 200-day moving average is near $82,000, a level that Bitcoin is struggling to recover.
Immediate support lies at $78,000, the early May low, with additional support in the late April capitulation zone. The RSI indicates further downside room, while the MACD shows increasing selling pressure.
A large $635 million ETF outflow complicates the situation, making it harder to maintain support levels. A successful close above $79,000 would support bullish sentiment ahead of the Trump-Xi negotiations and macroeconomic data release.
Case of the bull: A less divisive joint statement on Taiwan boosts risk appetite, helping Bitcoin reclaim $80,000 and target $85,000.
Reference case: BTC USD price is trading between $78,000 and $80,000 as the market awaits developments on geopolitical and inflation issues.
Bear case: Hawkish headlines at the top or higher-than-expected inflation could push the price above $80,000, leading to a retest of the $81,500-$83,000 range.
Solana at $90: significant losses but fundamentals hold
Solana fell -4% to $90.5, the steepest drop among the cohort’s top assets and a move that restored most of the weekly gains that had made SOL the standout altcoin over the previous two weeks.
A recent analysis of Solana’s price structure identified the $90-$92 area as a critical demand zone; trading in this range with high volume is the short-term test the network now faces.
The divergence between price and on-chain activity is notable. Network fees have increased by about 81% over the past week to around $4.2 million per day, with trading volume nearing $45 million per day, moves driven by sustained memecoin activity on platforms like Pump.fun.
$ SOL formed a nice falling wedge pattern which is a bullish reversal pattern pic.twitter.com/iBUE0RfZC2
– Don 🐂 (@DonWedge) May 14, 2026
This fundamental strength does not prevent the price from following Bitcoin lower in a risk-free macro environment, but it does suggest that the selling is driven by external factors rather than a reflection of deteriorating network health.
Immediate resistance for SOL lies between $94 and $95, where the asset was trading before the session’s decline. A recovery above this level would suggest that this is a macroeconomic development rather than a trend reversal. Failing to hold $88 at the close would indicate that the correction still needs to continue, with the next significant support being near $84.
The remainder of the Trump-Xi summit, and whatever common language emerges on Taiwan and trade, will likely determine whether Thursday’s Asian session marks a bottom or the start of a deeper correction in both Bitcoin and altcoins.
Traders should also note that the CME Bitcoin derivatives expiration on Friday may generate short-term volatility between $78,000 and $80,000 regardless of macro direction.
following
Disclaimer: Coinspeaker is committed to providing unbiased and transparent reporting. This article is intended to provide accurate and current information, but should not be considered financial or investment advice. Because market conditions can change quickly, we encourage you to verify the information for yourself and consult a professional before making any decisions based on this content.

Daniel Frances is a technical writer and Web3 educator specializing in macroeconomics and DeFi mechanics. Hailing from crypto since 2017, Daniel leverages his experience in on-chain analytics to write evidence-based reports and in-depth guides. He holds certifications from the Blockchain Council and is dedicated to providing “insight gain” that overcomes market hype to find real utility for blockchain.


