




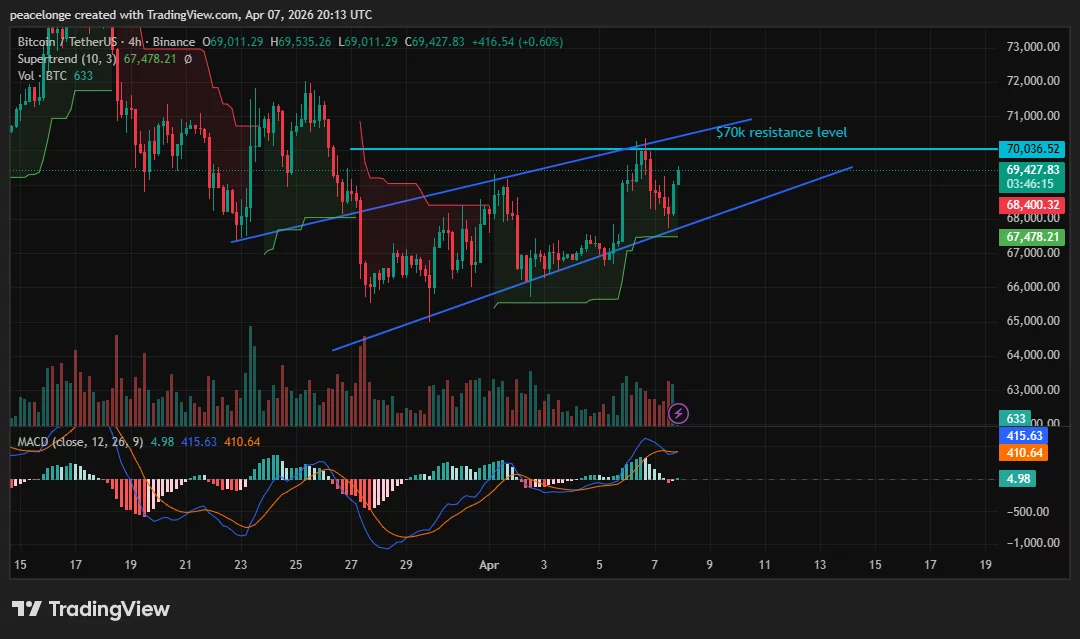
Bitcoin price briefly touched $70,000 on April 7 in a well-formed ascending channel on the 4H chart, while spot ETF inflows recorded $471 million on April 6, the strongest one-day institutional demand figure since late February.
Summary
- Bitcoin price reached an intraday high of $70,036 on April 7 before declining to $69,427, pushing the upper boundary of a 4-hour ascending channel that has existed since late March.
- The MACD 4H prints a bullish crossover with the MACD line at 415.63 above the signal at 410.64 and a positive histogram at 4.98, while the Supertrend at $67,478 provides trailing support below the price.
- A confirmed H4 close above $70,036 targets resistance at $71,000, while a break below the supertrend at $67,478 exposes $66,300 as the next structural level.
Bitcoin (BTC) price is trading at $69,427 on April 7, after hitting an intraday high of $70,036, the first test of the $70,000 level since March 26. The move was accompanied by $471 million in Bitcoin ETF spot inflows on April 6, the 6th largest daily figure of 2026 according to SoSoValue data. The 4H chart shows an ascending channel in place since late March, with prices printing consecutive higher lows from the $65,000 to $70,000 area, but round number resistance has capped the advance over several sessions.
On the 4H chart, Bitcoin is trading within a defined ascending channel constructed by two parallel diagonal trendlines. The lower boundary aligns with the supertrend at $67,478 and has served as dynamic support throughout the recovery. The upper boundary coincides with the $70,036 resistance annotated on the chart. The MACD 4H is in a confirmed bullish crossover, with the MACD line at 415.63 trading above the signal at 410.64 and a positive histogram at 4.98, reflecting the surge even as price falters in the face of resistance.
Analyst Michael van de Poppe of MN Trading Capital wrote on X on April 4 that “the longer the range persists, the bigger the breakout becomes,” adding, “I expect a breakout above $71,000.” Investech’s technical analysis published on April 7 shows that Bitcoin “gave a positive signal of the formation of the double bottom by breaking resistance at $68,120”, with a further rise to $69,769 or higher reported. This objective has already been achieved, thus strengthening the short-term arguments.
Key Levels: Support $68,400, Bullish Target $71,000, Invalidation $67,478
The $68,400 level visible on the 4H chart constitutes the immediate structural support below the current price. A close below exposes the Supertrend to $67,478, which is the level to invalidate the bullish thesis. Investtech identifies $66,300 as the next support below, representing a potential 4.5% downside from current levels in the bearish case. On the upside, a confirmed 4-hour close above $70,036 resolves current resistance and opens the way to the $71,000 level according to van de Poppe’s analysis, with the ascending channel structure remaining intact as long as the Supertrend holds.
ETF Flows Drive Independent Institutional Demand
Spot Bitcoin ETFs have attracted steady inflows over the past few sessions, with the $471 million on April 6 reflecting renewed institutional appetite at current price levels. According to Binance Research, Bitcoin’s correlation with its Global Easing Breadth Index “turned sharply negative following the launch of spot bitcoin ETFs,” suggesting that ETF demand now operates more independently of broader macroeconomic conditions. Iran’s ceasefire negotiations on April 6-7 provided a short-term macroeconomic catalyst, but ETF buyers were already positioned ahead of the move, strengthening the institutional demand floor near current levels.
If $70,036 continues to act as resistance, a retest of $68,400 and then the supertrend at $67,478 will become the most likely near-term path before any further breakout attempts. A sharp 4H close above $70,036 with volume confirmation targeting $71,000 as the next resistance.


