




DeXe (DEXE) is posting new highs for weeks, gaining 45% in the last seven days alone and over 1,000% in the last 180 days, as reflected in the chart.
Over the past 24 hours, the asset began to retreat as buyers backed out and locked in profits, a shift that caused the asset to fall by approximately 13% during the period.
The graphic structure, however, indicates a possible temporary decline, with the price still positioned to extend its rise in the long term.
DeXe doji candles reveal a dead end
DeXe printed two telltale doji candles in the early hours of the day.
The first, a tombstone doji, reflected intense selling pressure as the price attempted to extend its rise, while a dragonfly doji formed a few candles later and signaled the return of the bulls.
Price is currently decidedly bearish and the near-term outcome depends on the key demand areas mapped on the chart.
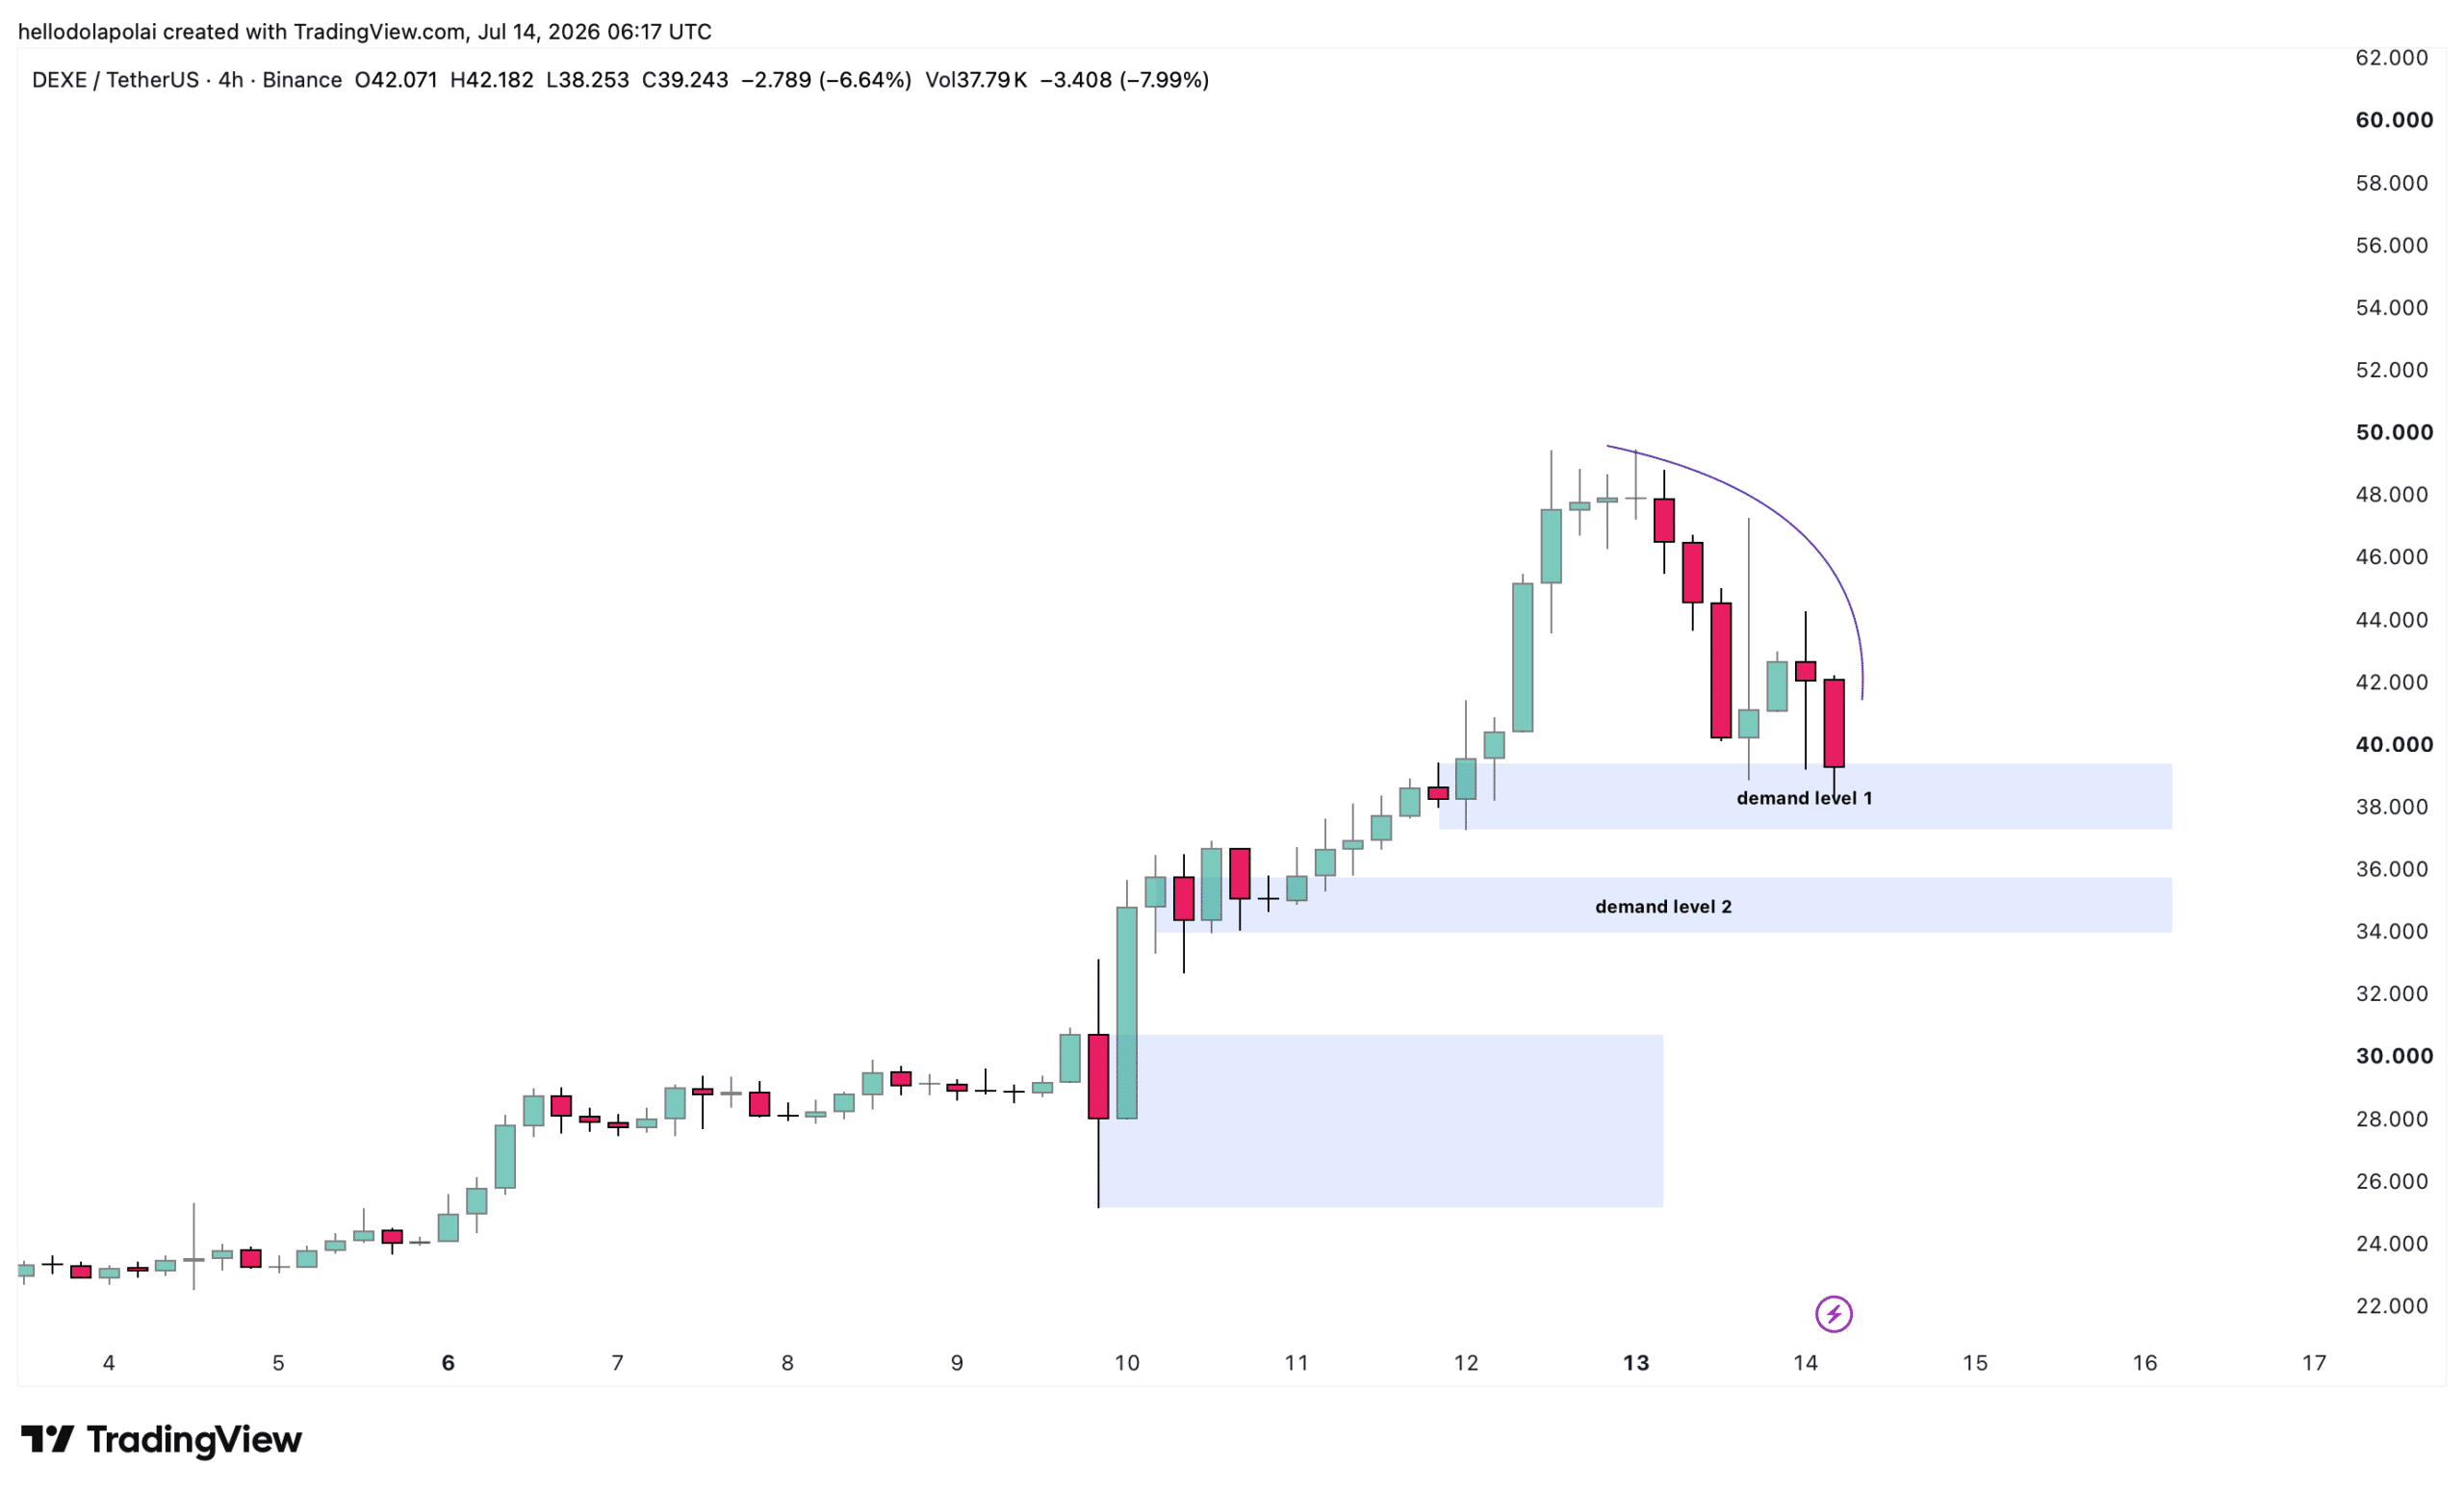
Demand zone 1 offers the first line of support, and a sufficient rebound there could push prices higher to eliminate the overhead liquidity marked by the curved line on the left.
If selling pressure continues to build and this level gives way, Demand Zone 2 is poised to cushion prices and absorb the pressure that has weighed on the asset for most of the day.
Maintaining demand zone 1 remains the most likely scenario, and volume data supports this reading, with volume down 36% over the period.
A decline in volume accompanied by a decline in price often indicates that the momentum behind the move is weak, allowing buyers to take control.
Indicators point to a slowdown rather than a reversal
Momentum indicators are not fully aligned with bearish price action, and the Accumulation/Distribution (A/D) indicator captures this tension.
The A/D line weights each period’s volume based on when the price closes within its range, serving as an indicator of whether an asset is accumulating or distributing.
At the time of writing, the trend was slightly upward even as prices fell, a divergence that suggests a slight increase in buyer activity over the period.
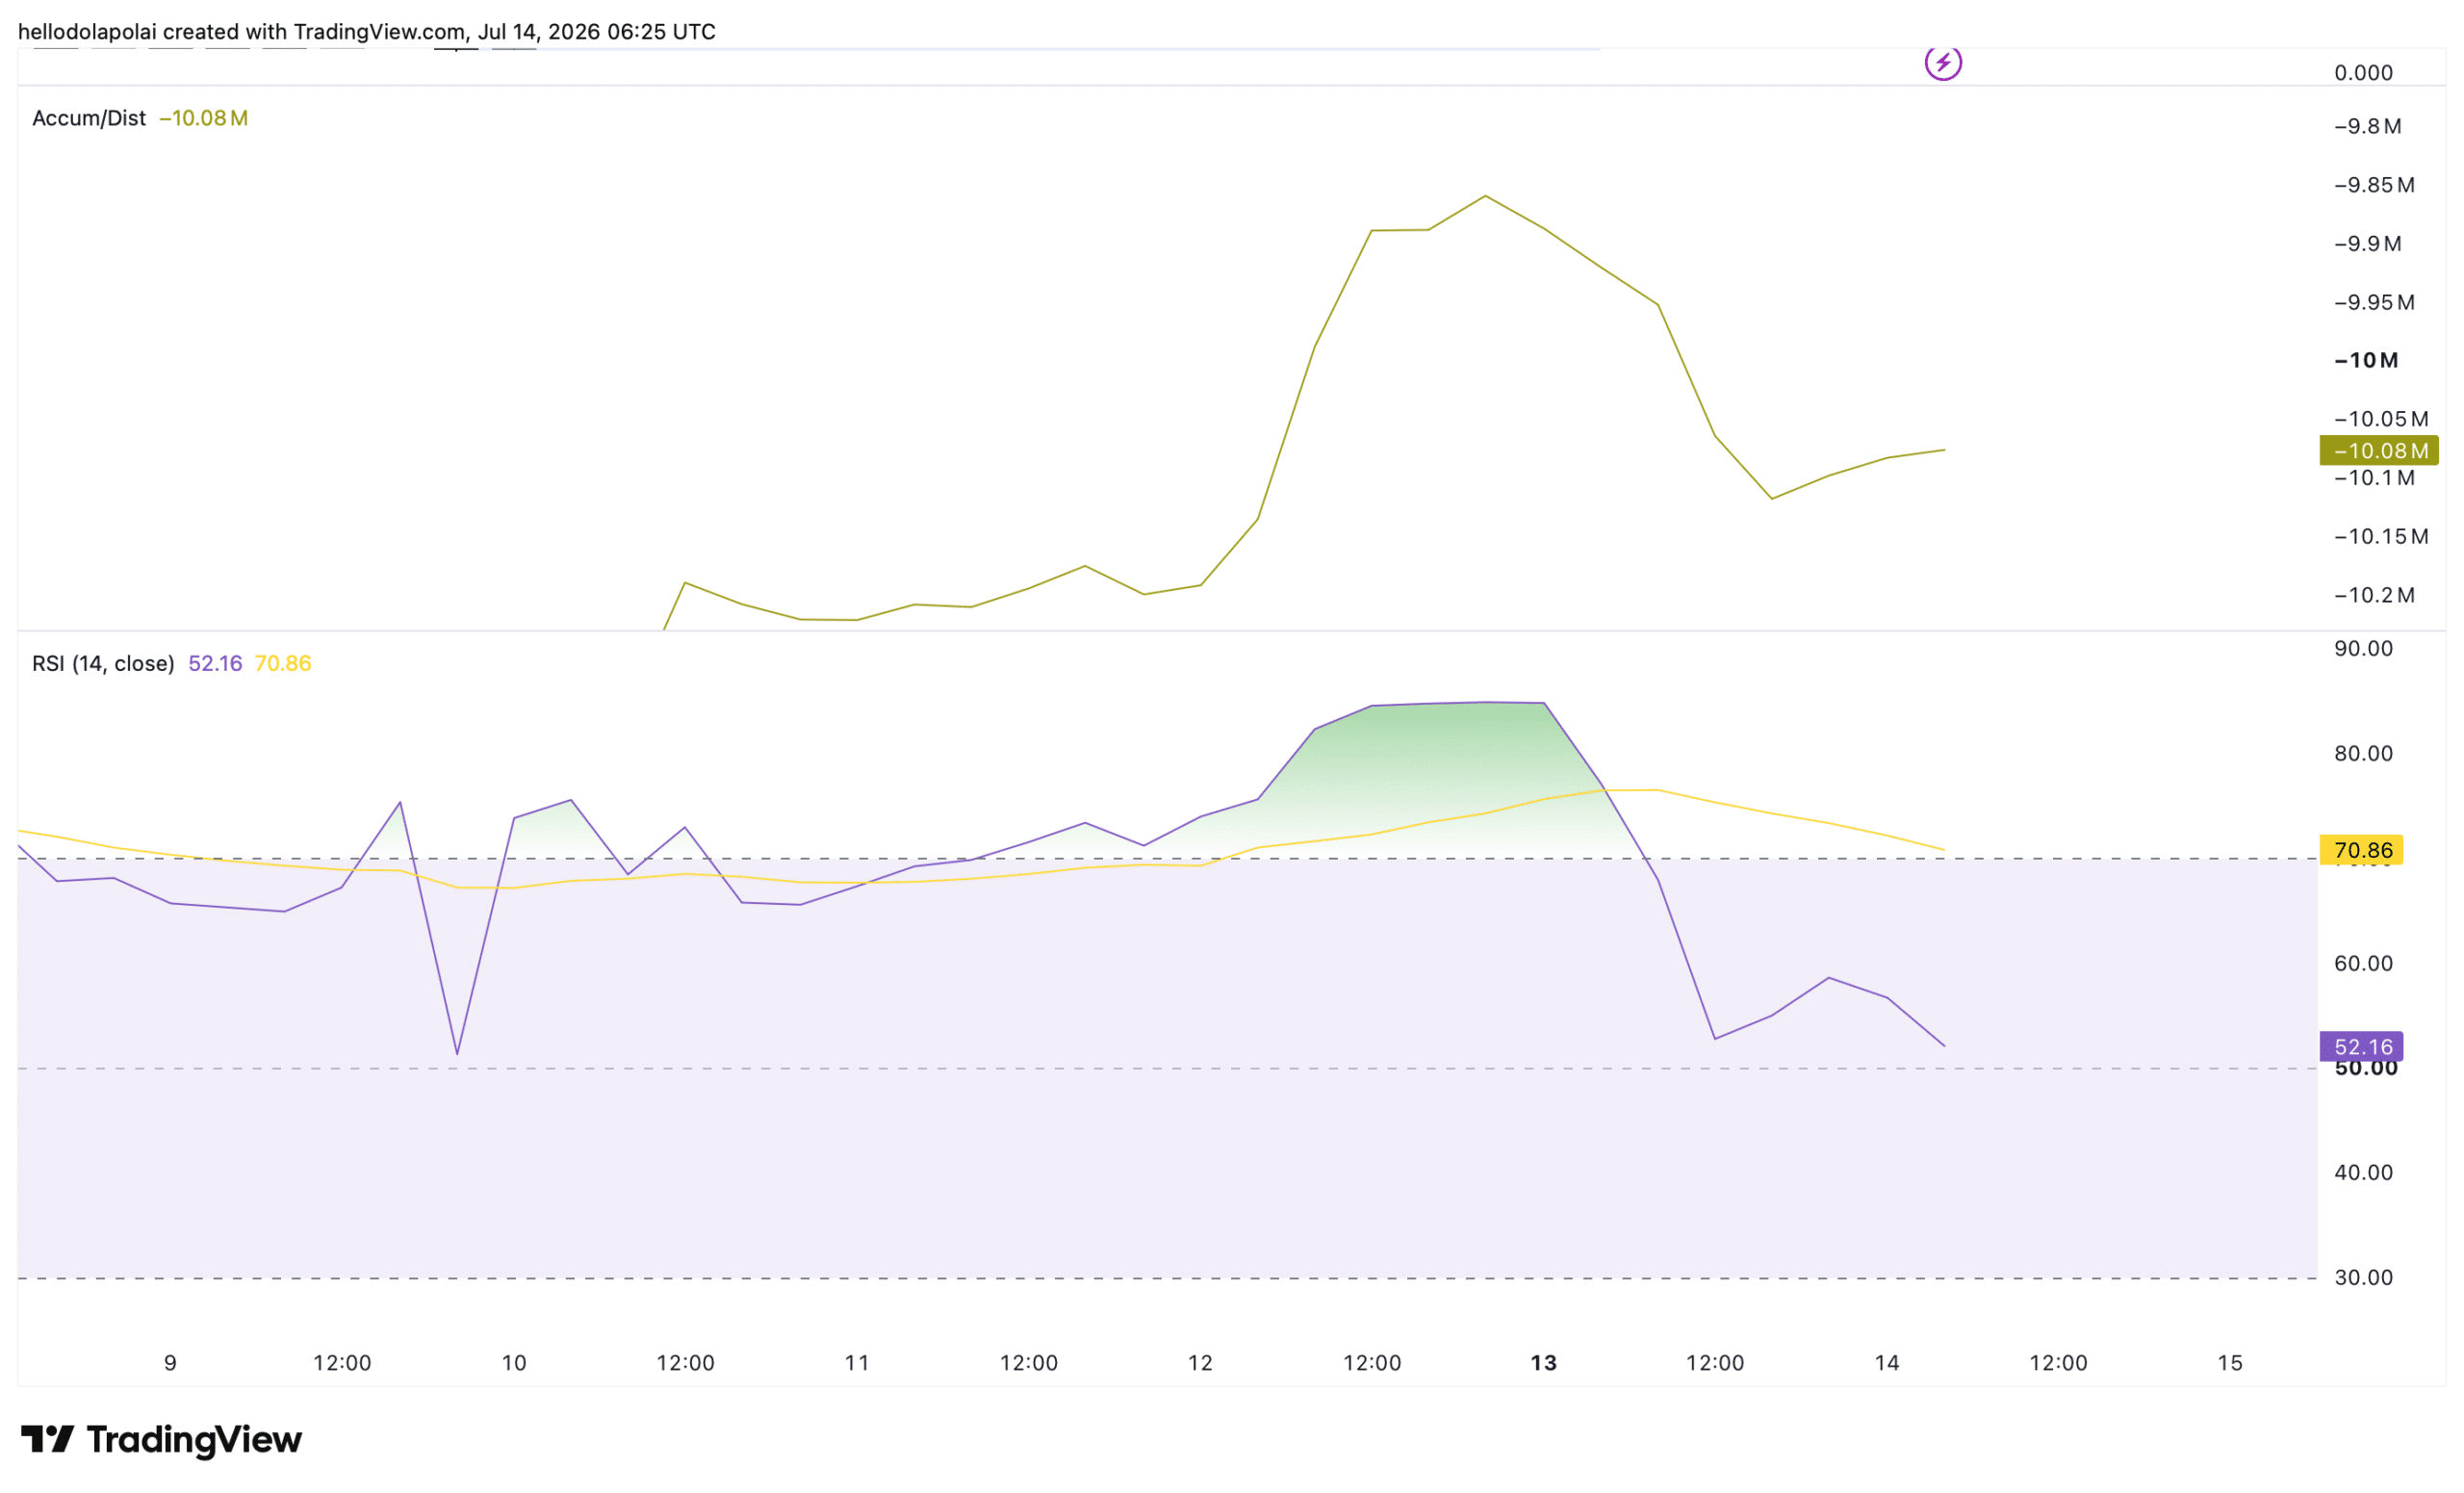
Likewise, the Relative Strength Index (RSI) is holding within the bullish band of 50 to 70 at a reading of 52.
The RSI measures the speed and magnitude of recent price movements, and a reading right on the midline indicates neutral, relaxed sentiment rather than a decisive bearish change.
The balance sheet suggests that the price is likely to stabilize around this level, which coincides with the demand zone.
Selling pressure eases on the Spot market
Spot market data so far indicates an easing of selling pressure. The cash net flow reached its highest net sales on July 12, as sellers dominated and net inflows reached $5.38 million.
Although sellers still had the upper hand, the net flow plunged to just $391,000, more than ten times lower than the previous figure.
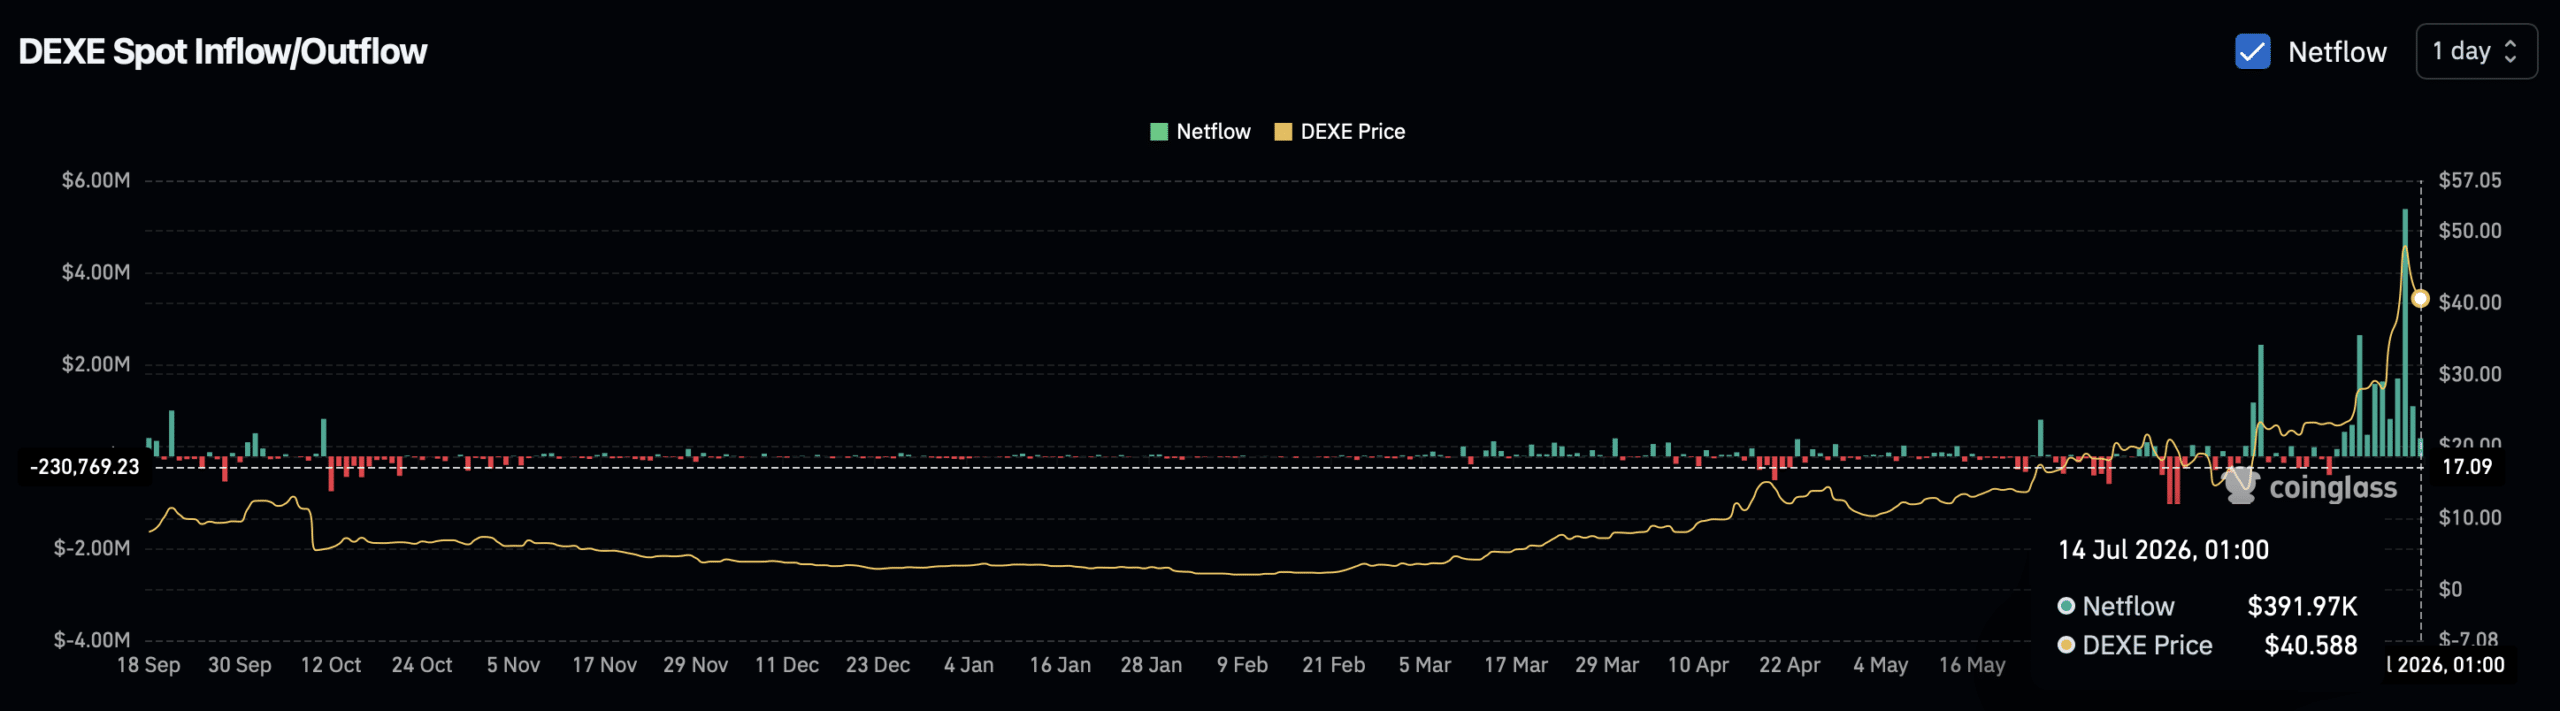
This is important because it shows that the strength of sellers has weakened significantly based on net flows as buyers step in.
Final summary
- DeXe has surged more than 1,000% in the past six months, and the current 13% drop looks more like profit-taking after a strong run than a change in trend.
- Sales slowed sharply over the past day, with net sales more than ten times lower than the July 12 peak, a sign that buyers may be returning.


