




Ethena’s Coinbase custodial wallet transferred 290 million ENA worth $26.41 million to a personal wallet with a history of sending tokens to exchanges. As expected, the transaction has reignited concerns about another distribution round in the market, as the receiving address had previously moved ENA to Binance and Coinbase.
However, traders did not immediately respond with aggressive selling despite the size of the transaction. Instead, market activity suggested that participants were waiting for confirmation before adjusting their positions.
The move also came as ENA traded near a significant resistance area, increasing focus on the ability of buyers to absorb incoming supply.
As a result, portfolio movement focused on trading flows and price structure rather than creating an instant bearish reaction in the market.
One-time releases compensate for distribution problems
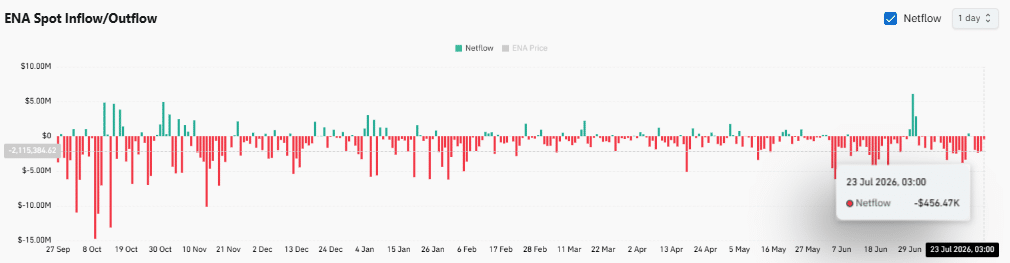
Despite the scale of securities transfers, data on trading flows painted a more balanced picture at the time of publication. ENA’s daily spot net flow, for example, remained negative at -$456.47,000, indicating that FX outflows still exceeded inflows.
The reading suggests that the broader market continues to cash out tokens instead of sending them to centralized exchanges for immediate sale. Although the guard operation raised further concerns, overall flow data failed to confirm widespread distribution.
Additionally, recent sessions have shown negative Netflows dominating most observations despite occasional positive spikes.
This trend reduced the immediate foreign exchange supply and mitigated the bearish implications of the transfer of 290 million ENA.
Nonetheless, traders would likely need sustained negative net flows to preserve this advantage, as sustained inflows could quickly build selling pressure.
Will the ENA then be able to overcome the resistance?
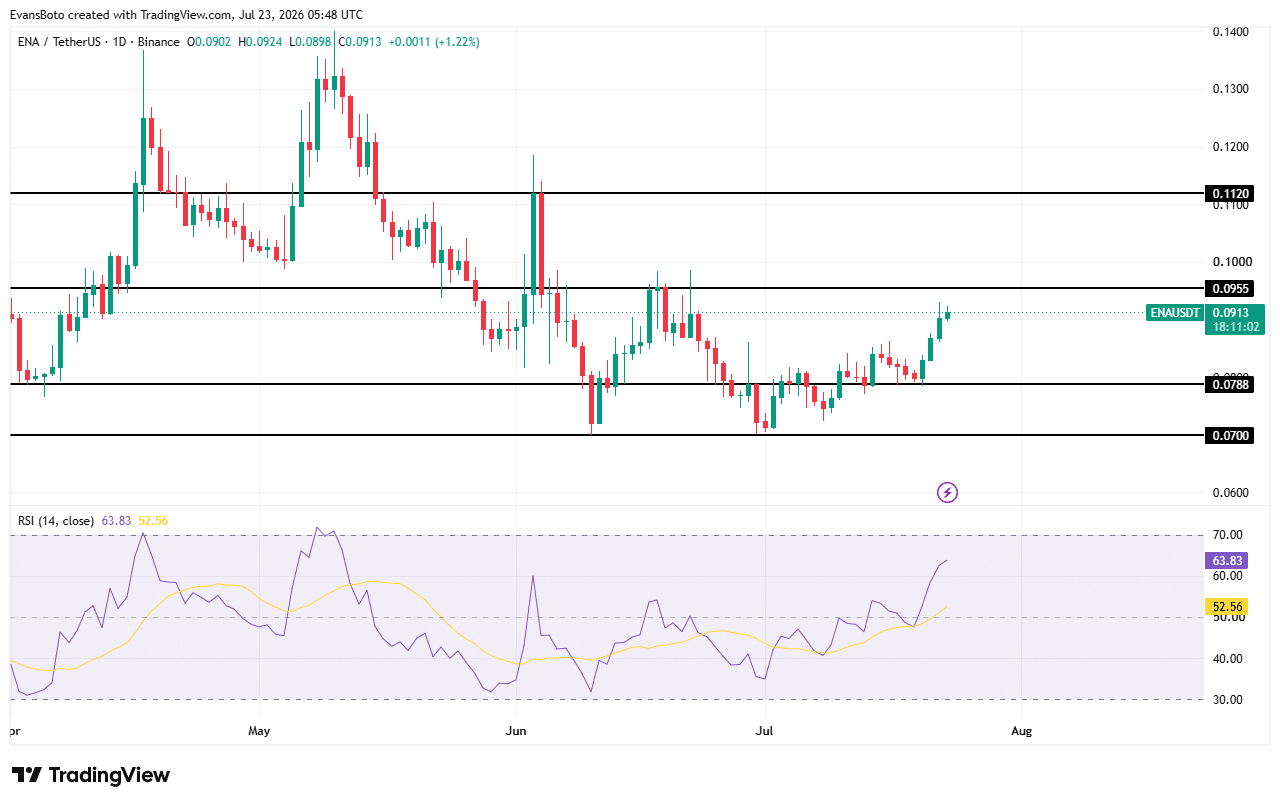
At the time of writing, Ethena (ENA) was trading in around $0.0913 after extending its recent recovery towards the $0.0955 resistance level. Buyers consistently defended higher lows, allowing the price to recover from the $0.0788 support established earlier this month.
Meanwhile, the 14-day RSI climbed to 63.83 while its moving average settled at 52.56, reflecting an increase in buying interest without entering overbought territory.
This improvement suggests that bullish participation increased as the price approached its overhead resistance.
Despite this, ENA is still trading below the strongest resistance of $0.1120. This remains the next major hurdle if buyers get a breakout above $0.0955. Failure to regain this level would likely encourage a retest at $0.0788, while a confirmed breakout could open the way to $0.1120.
Where could the next ENA volatility arise?
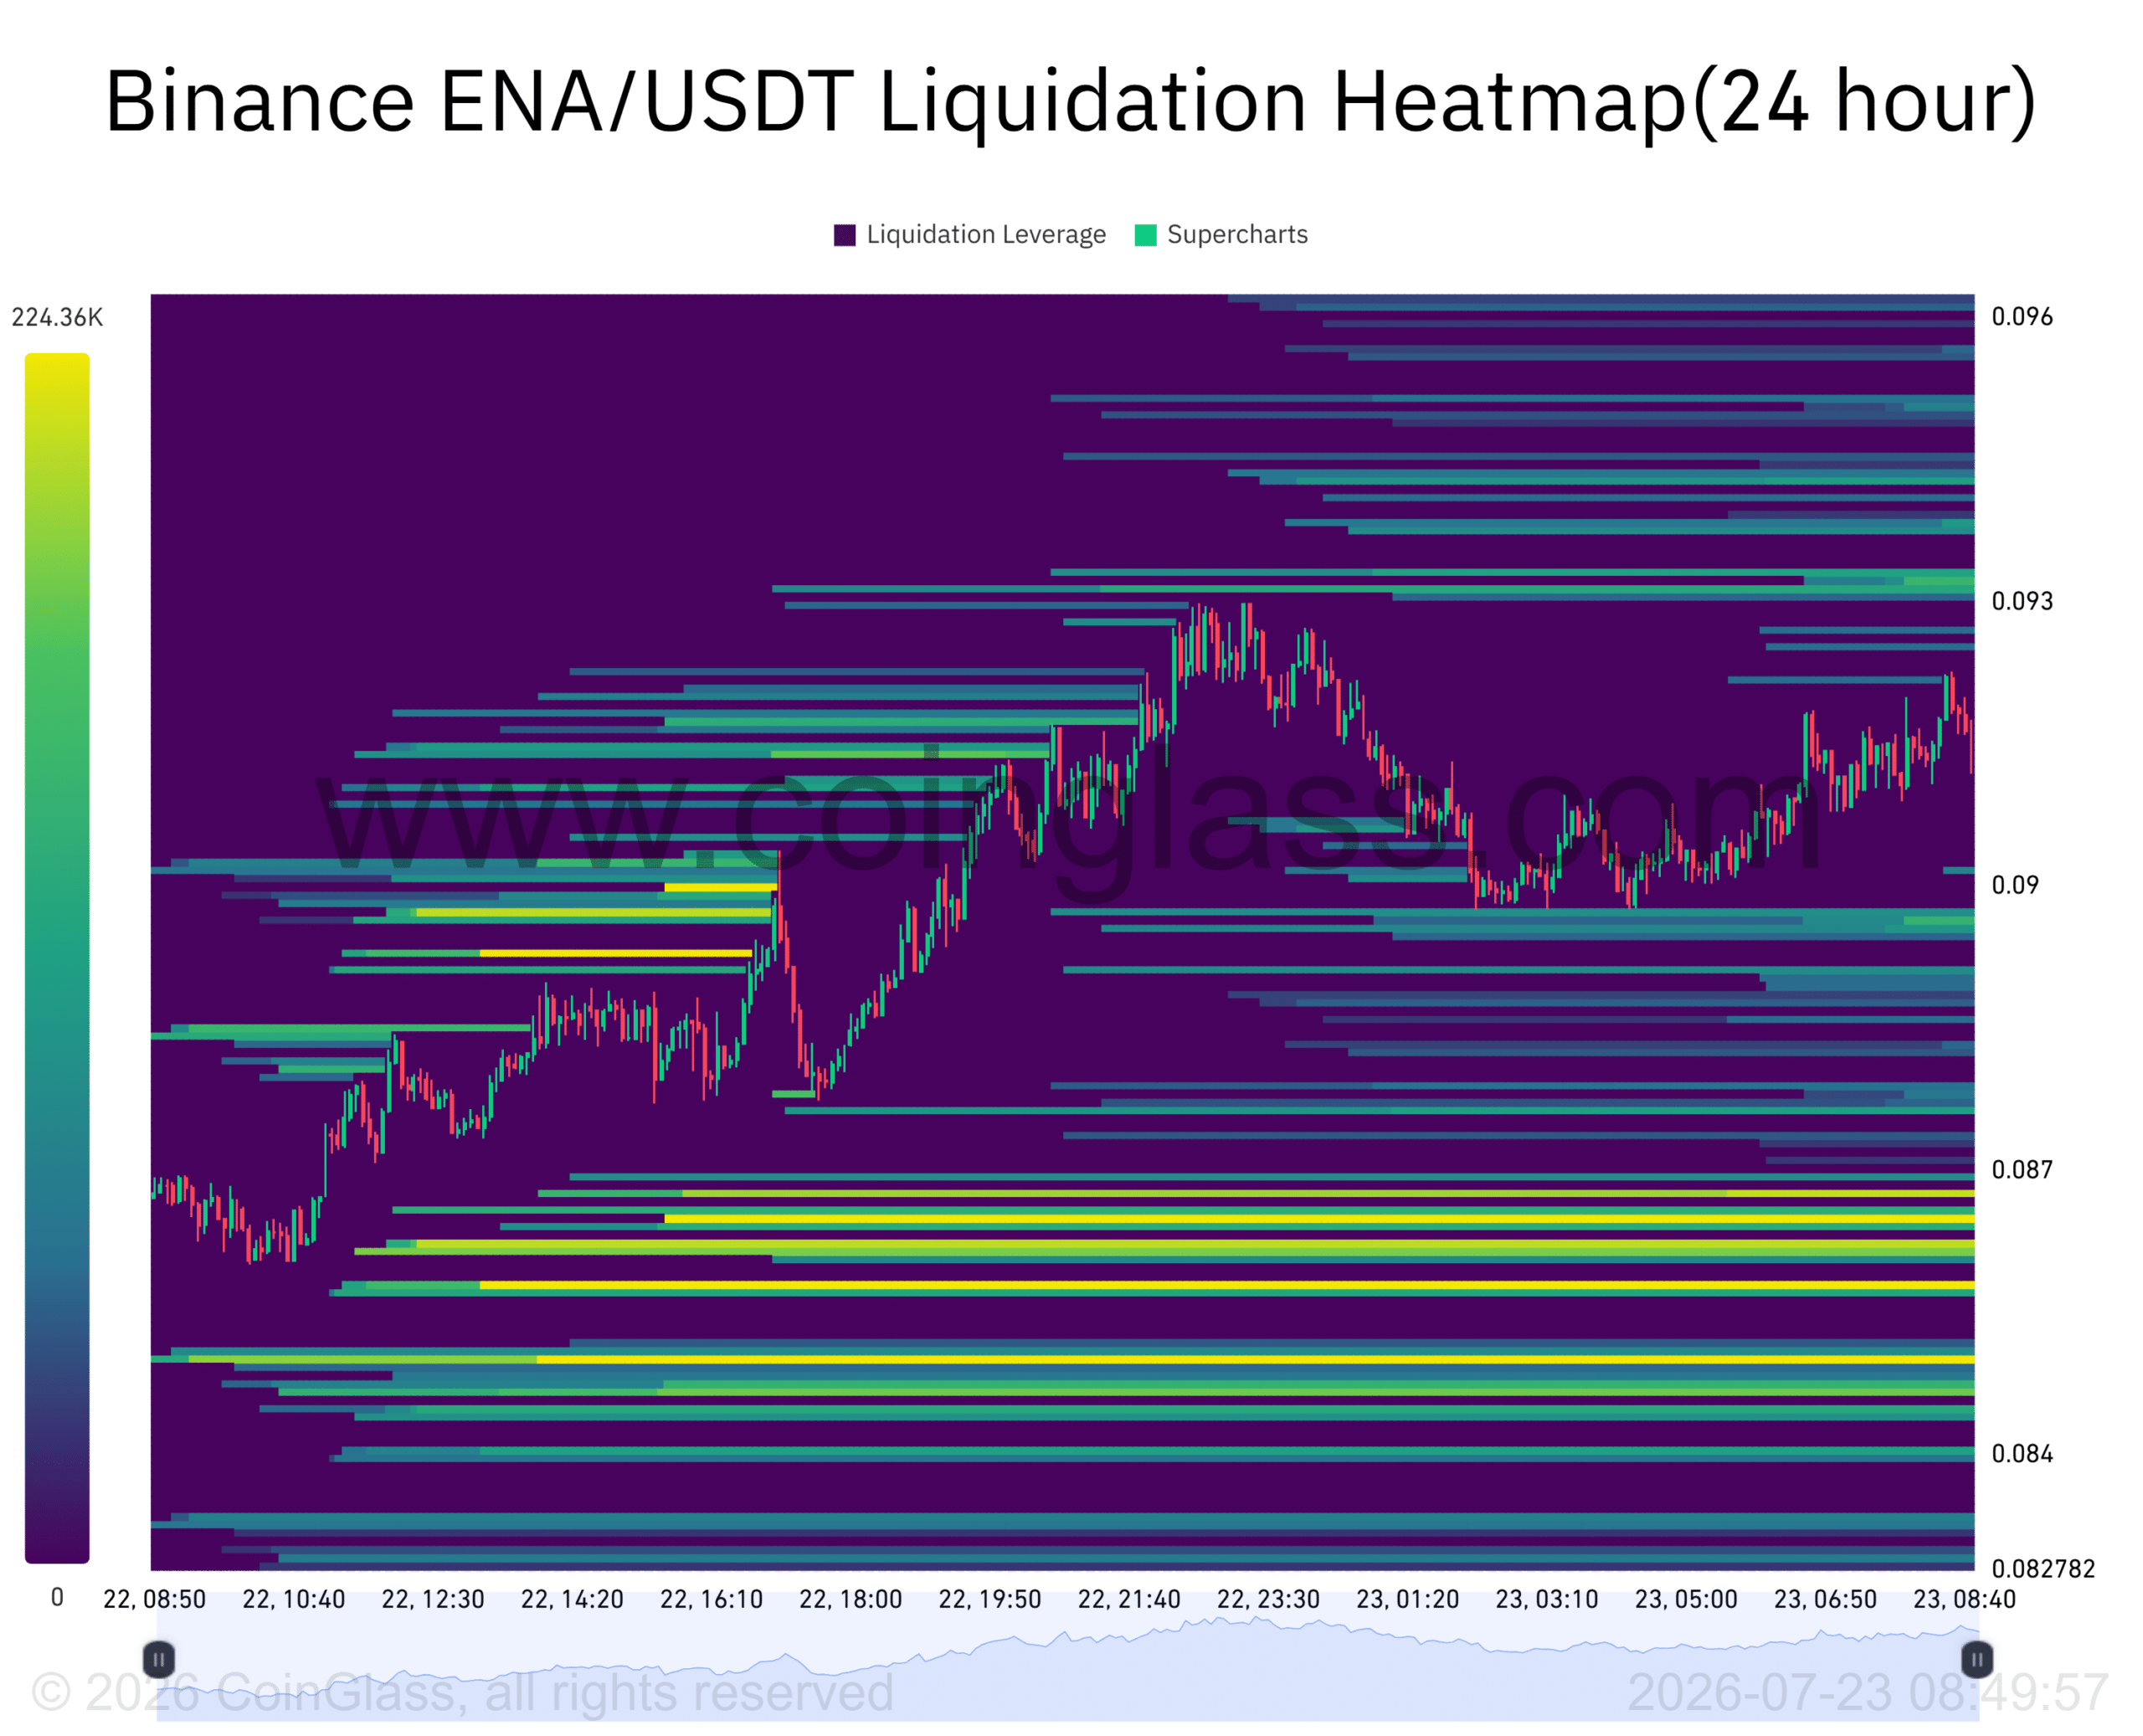
Finally, liquidation data highlighted several leveraged positions around the ENA trading range.
The closest concentration of short liquidations appeared slightly above $0.093, meaning a successful breakout could force bearish traders to close their positions and accelerate buying activity. However, significant liquidity has also concentrated below $0.087, creating a downside magnet if the price loses its nearby support.
Opposing liquidation pockets hinted at balanced leverage, despite the recent rally.
Rather than confirming a clear directional bias, the heatmap indicates that volatility would likely increase once ENA reaches either liquidity zone.
Traders should likely monitor these levels closely, as liquidation-induced moves often intensify short-term price fluctuations beyond ordinary spot market activity.
Final summary
- Buyers approached the $0.0955 resistance while liquidation zones hinted at higher volatility ahead.


