


Ethereum is trading above $2,300. The 8-9% movement in 24 hours allows it to outperform Bitcoin. And an analysis from XWIN Research Japan identified something that separates the current rally from every short-term bounce Ethereum has produced in recent months: the catalysts this time are not of the same type.
The analysis documents a simultaneous convergence of three independent developments arriving within days of each other. On April 13, the SEC issued a staff statement clarifying that certain DeFi user interfaces – front-end and wallet-based applications – can operate without broker registration provided they meet specific conditions.
In practical terms, the regulator that has cast the longest shadow over institutional adoption of DeFi has just signaled that DeFi can be treated as a neutral technology layer rather than a securities distribution mechanism. This is not a minor clarification. This is a structural reduction in regulatory risk for the entire Ethereum ecosystem.
On-chain data confirms that the change is being felt in actual behavior. Active addresses on Ethereum tend to increase: network usage increases, not just price. At the same time, the Coinbase Premium Gap is improving, suggesting that U.S.-led demand – the institutional demand that was noticeably absent during previous recovery attempts – is starting to return.

Three catalysts. A week. None of them are levers.
The institutions have arrived
XWIN Research Japan’s analysis adds the layer of capital that transforms regulatory and on-chain signals into a complete structural picture. ETF inflows have recorded three straight days of net inflows, reaching the highest weekly levels of 2026. These are not traders reacting to a price movement – these are portfolio allocators making sustainable, deliberate decisions to increase exposure to Ethereum at an institutional level. Three consecutive positive days at a 2026 weekly high describe conviction, not momentum.
At the company level, the signal is even more precise. Bitmine now holds around 4.8 million ETH, or over 4% of Ethereum’s total supply, after adding over 70,000 ETH in the last week alone. The parallel with MicroStrategy’s Bitcoin accumulation strategy is not accidental. That’s the point.
When a publicly traded company begins treating an asset as a cash reserve rather than a speculative position, it permanently removes supply from the liquid market and signals a belief in long-term value that short-term price action cannot produce.
The analysis presents the combined picture accurately: this is not a rebound due to leverage. This is a structural change. Regulatory clarity, institutional flows, and increasing network activity arrived simultaneously – and when these three forces align on the same asset at the same time, the question is no longer why the price rose and starts with what the asset is becoming.

Ethereum is transitioning into what the analysis calls a DeFi infrastructure asset – a category distinct from speculative tokens and store of value, one in which the network’s utility as a settlement and execution layer for global finance becomes the primary driver of institutional demand. The price has begun to reflect this transition. The structure below suggests that the transition is not complete.
Ethereum is attempting to recover after a strong structural breakout in February that sent the price from the $3,000 region to sub-$2,000 levels in a high-volume capitulation move. This event remains the dominant feature of the chart, marking a clear shift from a distribution phase to a positioning reset.
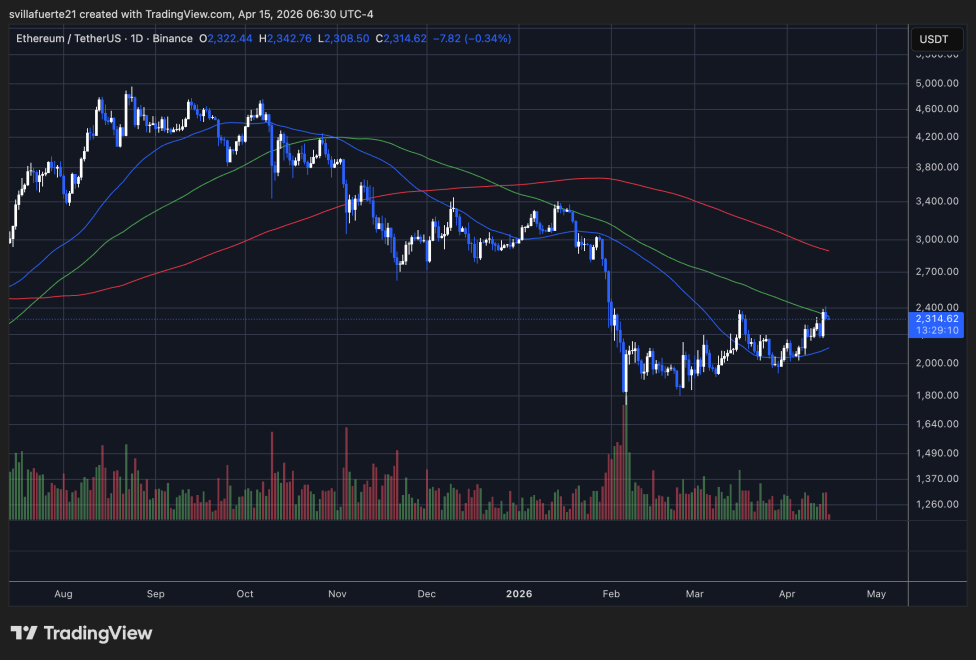
Since then, ETH has established a base between approximately $1,900 and $2,200, with repeated higher lows suggesting a gradual absorption of selling pressure. The recent push towards $2,300-$2,400 places the price in a critical supply zone, previously acting as support before the breakout and now functioning as resistance.
Technically, ETH is still trading below the 200-day (red) and 100-day (green) moving average, both of which are trending lower, confirming that the broader trend remains bearish despite near-term strength. However, the 50-day moving average (blue) flattens out and begins to rise, indicating improving short-term momentum.
Volume has declined significantly from February’s peak, suggesting the rally is controlled rather than impulsive. This generally reflects repositioning rather than aggressive speculation.
The key question is whether ETH can recover and hold above $2,400. Failure here probably extends the scope. Acceptance above this threshold would move the structure towards a sustainable recovery phase.
Featured image from ChatGPT, chart from TradingView.com
Editorial process as Bitcoinist focuses on providing thoroughly researched, accurate and unbiased content. We follow strict sourcing standards and every page undergoes careful review by our team of top technology experts and seasoned editors. This process ensures the integrity, relevance and value of our content to our readers.