





Ethereum is consolidating between $2,200 and $2,400 as the market searches for the catalyst or structural confirmation that will force a decisive breakout in either direction. Price is holding but not moving forward – and a CryptoOnchain analysis tracking Binance on-chain flows has identified a sequence of capital movements between May 10 and 12 that suggests something considerably more deliberate than usual market activity is going on beneath the surface.
The streak begins on May 10, when Binance recorded its largest net Ethereum inflow of the last six months – 225,558 ETH deposited in a single day. In isolation, a deposit of this size on an exchange would generally be interpreted as a precursor to selling: large holders moving the coins to where they can be converted into other assets or cash. The concern caused by the reading is real and historically justified.
What happened two days later changes the interpretation. On May 12, Binance recorded an extreme stablecoin outflow of $1.32 billion – capital simultaneously leaving the exchange in the opposite direction. Large entities weren’t just depositing ETH and getting ready to sell. At the same time, they removed their purchasing power from the stock market.
CryptoOnchain identifies this combination as a structural transfer – a whale-scale portfolio rebalancing event rather than a simple distribution. Understanding what the large participants were actually doing with these flows is what the analysis aims to explain.
The spot market is turbulent. The derivatives market is surprisingly calm
CryptoOnchain analysis identifies the divergence that makes Ethereum’s current setup structurally unusual. While the spot market has processed the large ETH inflows and stablecoin outflows of recent days, the derivatives market on Binance has been moving in a quietly constructive direction that spot activity alone could not predict.
Ethereum funding rates on Binance have definitely moved from negative territory – where they stood at -0.007 in early May – to positive at +0.004. The change in direction matters more than its magnitude: funding that was consistently negative reflects months of bearish conviction in derivatives. The shift to positive signals indicating that long positions have become dominant in the perpetual market. Simultaneously, open interest increased by around 13% – with new positions being added as confidence returns, rather than simply maintaining existing positions.

The detail that makes this derivatives picture truly meaningful is the liquidation data. Despite the accumulation of debt and the expansion of open positions, liquidations fell 99.6% below their three-month average, hovering near absolute zero. Increasing leverage without forced exits describes a market in which participants adding positions do so with sufficient collateral and are confident that adverse price movements do not trigger cascading events.
The dual narrative identified by the report is the honest synthesis of the two signals. Spot markets experience aggressive rotation: large amounts of capital move in both directions simultaneously. Derivatives markets are accumulating cautiously but with growing confidence. The combination suggests maturity rather than speculation. The risk the analysis guards against is external: localized leverage based on improved confidence can absorb internal pressure, but a sudden macroeconomic shock arises from outside the structure.
Ethereum trades at critical long-term pivot as multi-year support holds
Ethereum is trading around $2,250 on the weekly chart, consolidating directly around a historically important price region that has repeatedly acted as support and resistance throughout the current cycle. The structure reflects a market caught between recovery risk and continuation risk, with neither bulls nor bears fully controlling the dynamic.
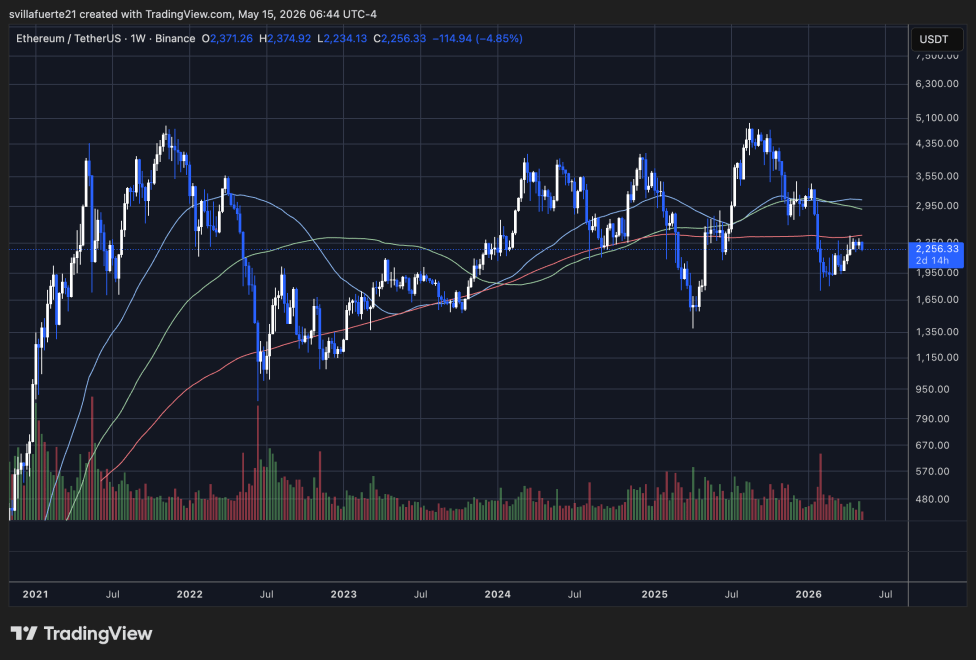
The chart shows that ETH is recovering from the sharp correction that followed rejection from the $4,000-$4,500 region in late 2025. After briefly losing the $2,000 level earlier this year, buyers managed to stabilize the price above a major long-term support zone near the 200 weekly moving average. This recovery prevented a deeper structural breakout and brought Ethereum back into the broader consolidation range that has defined much of the last two years.
However, the upward momentum remains limited. Ethereum continues to trade below the long-term descending moving averages, particularly the weekly 100 and 50 moving averages, which are now converging towards the $2,400-$3,000 region and continue to act as overhead resistance. The repeated inability to return to these levels reflects the continued hesitation of market participants despite the improvement in the macroeconomic structure.
Volume has also moderated significantly from the capitulation phases seen during previous sell-offs, suggesting a cooling of aggressive distribution. For now, Ethereum remains trapped in a squeeze phase that could determine the direction of the next major move in the cycle.
Featured image from ChatGPT, chart from TradingView.com
Editorial process as Bitcoinist focuses on providing thoroughly researched, accurate and unbiased content. We follow strict sourcing standards and every page undergoes careful review by our team of top technology experts and seasoned editors. This process ensures the integrity, relevance and value of our content to our readers.


