





Ethereum (ETH) stabilized above the $3,000 mark after a sharp sell-off earlier this week as large holders increased their exposure during the decline. The rally follows a volatile period in which ETH briefly fell below key technical levels, triggering selloffs and renewed caution in the broader crypto market.
On January 22, Ethereum was trading around $3,003, up about 1.3% over 24 hours. The rebound came after ETH fell nearly 13% between January 19 and 21, touching the $2,900 zone for the first time in four weeks.
This decline coincided with increased macroeconomic uncertainty, ETF outflows and the liquidation of more than $480 million in bullish leveraged positions.
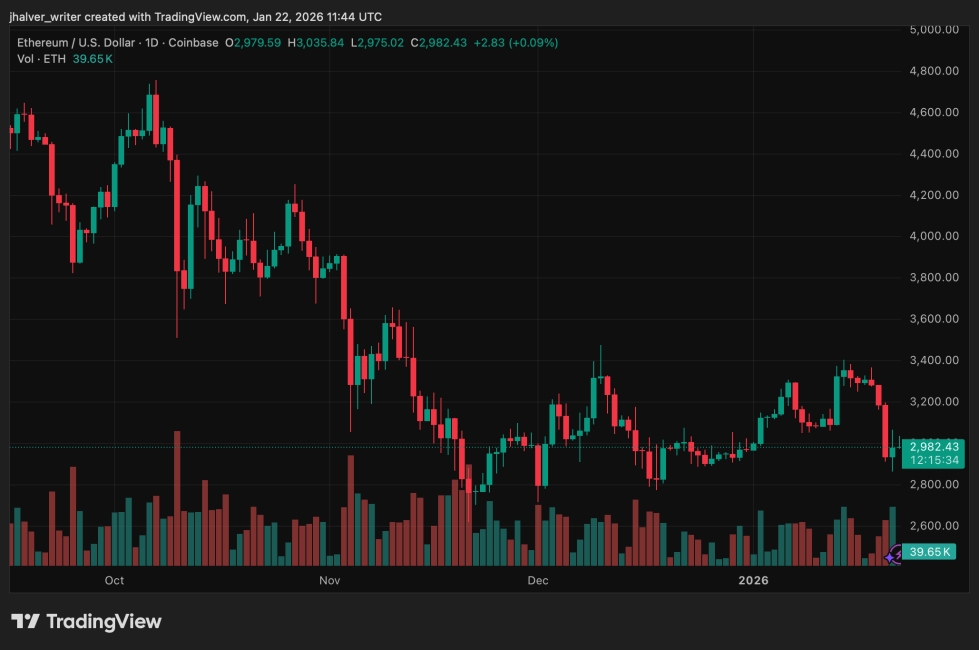
ETH's price trends to the downside on the daily chart. Source: ETHUSD on Tradingview
Ethereum accumulation contrasts with cautious positioning
On-chain data shows that large Ethereum holders have been accumulating aggressively during the recent downturn. Whale balances increased by approximately 290,000 ETH over a two-day period, representing purchases worth nearly $360 million at current prices.
This behavior suggests that some long-term investors view the recent pullback as a buying opportunity. However, other indicators point to a more cautious attitude from experienced traders.
The Smart Money Index remains below its signal line, a level that has historically been breached before stronger bullish moves. In previous cases, such confirmations preceded double-digit gains, but no such signal has emerged so far.
The data on derivative products supports this wait-and-see approach. Funding rates for ETH perpetual futures briefly turned negative, indicating reduced confidence among leveraged traders. Options markets also showed increased demand for downside protection after repeated rejections near the $3,400 level over the past two months.
Technical Structure Highlights Narrow Trading Range
From a technical perspective, Ethereum is trading in a symmetrical triangle on the daily chart.
Momentum indicators show bullish divergence, the Relative Strength Index formed higher lows while the price made lower lows between November and mid-January. This trend suggests that selling pressure may be weakening, although confirmation is still lacking.
The immediate level to watch on the upside is $3,050, a former support zone that ETH lost during the recent sell-off. A sustained daily close above this level would indicate near-term stabilization.
Above this, the $3,146 to $3,164 range represents a dense supply zone, where approximately 3.4 million ETH has been accumulated. This area should provide strong resistance.
Related reading: Bitcoin took first place in crypto payments in 2025, with Litecoin third most used: CoinGate
On the other hand, failure to hold the lower boundary of the triangle near $2,910 could open the door for a deeper move towards the $2,610 support zone.
Cover image of ChatGPT, ETHUSD chart on Tradingview
Editorial process as Bitcoinist focuses on providing thoroughly researched, accurate and unbiased content. We follow strict sourcing standards and every page undergoes careful review by our team of top technology experts and seasoned editors. This process ensures the integrity, relevance and value of our content to our readers.


