





Ethereum has reclaimed the $2,300 level as resumption of buying activity begins to push the market higher after months of persistent downward pressure. The move marks a notable shift in short-term sentiment, with traders increasingly pointing to growing bullish momentum in the broader cryptocurrency sector.
Over the past seven days, Bitcoin has climbed approximately 8.6%, reinforcing the perception that the market may be exiting the corrective phase that has dominated recent months.
Ethereum, which often behaves as a higher beta asset within the crypto ecosystem, responded even more aggressively to the improving sentiment. During the same period, ETH surged around 13.9%, outperforming Bitcoin and signaling stronger speculative demand from traders.
Analysts note that this rise is also supported by strong inflows of crypto-related exchange-traded funds, reflecting the continued institutional appetite for digital assets. As liquidity begins to return and risk tolerance improves, Ethereum’s ability to regain the $2,300 level is now being closely watched as a potential pivot point that could determine whether the recovery can extend further in the coming weeks.
Ethereum Leverage Recovers After Historic Liquidation Reset
Recent analysis from CryptoQuant highlights how the Ethereum derivatives market underwent a significant structural reset following the dramatic liquidation event on October 10. According to the report, the flash crash triggered one of the most significant deleveraging events in the history of the cryptocurrency market.
During this event, Ethereum’s estimated leverage ratio (ELR) on Binance fell sharply from 0.56 to 0.41, representing a 27% contraction in market leverage. The “10/10” event is now widely recognized as the largest 24-hour liquidation stunt in crypto history, with over $19 billion in leveraged positions forcibly liquidated in the market.

Since this reset, debt levels have gradually recovered as confidence returned. The report notes that Ethereum’s ELR climbed to around 0.69 in mid-March, signaling that traders are once again increasing their use of leverage as sentiment improves.
The estimated leverage ratio is calculated by dividing open interest by the amount of ETH reserves held on exchanges. In practical terms, it measures how aggressively traders use leverage relative to the collateral available in the system.
Higher ELR values generally indicate increasing risk appetite and increased speculative positioning, which can amplify both upward price momentum and market volatility.
As sentiment improves, Ethereum and Bitcoin continue to act as high-beta risk assets, while more defensive investors could turn to tokenized gold instruments such as PAXG and XAUT.
Ethereum attempts to reverse trend after February capitulation
The Ethereum chart shows that the asset is attempting to build bullish momentum after a prolonged correction phase that has dominated the market since late 2025. On the daily time frame, ETH is currently trading around $2,310, following a strong rebound following the sharp sell-off that occurred in early February.
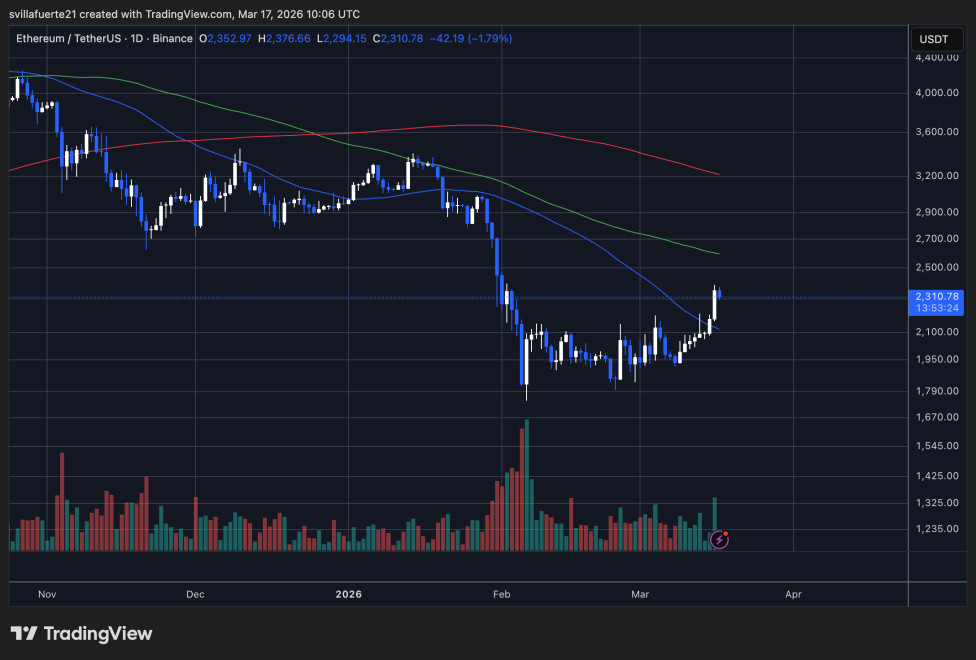
This decline pushed Ethereum towards the $1,800 region, where a sharp increase in volume indicates a capitulation event and aggressive buyer absorption. Since forming this low, the price action has gradually stabilized, with Ethereum building a higher base between $1,900 and $2,100 before initiating the current upward move.
Technically, ETH has now reclaimed the short-term moving average, which had acted as dynamic resistance throughout the downtrend. This development suggests that near-term momentum is moving back in favor of buyers. However, the broader market structure remains cautious as prices still trade below the long-term 100- and 200-day moving averages, which continue to decline.
The $2,300 to $2,400 area now represents a critical resistance region. This level previously served as support before the February breakout and is likely to attract significant sell-side liquidity.
If Ethereum manages to consolidate above $2,300, it could open the door for a continuation towards $2,600 and $2,900, where the next major technical barriers and moving averages converge.
Featured image from ChatGPT, chart from TradingView.com
Editorial process as Bitcoinist focuses on providing thoroughly researched, accurate and unbiased content. We follow strict sourcing standards and every page undergoes careful review by our team of top technology experts and seasoned editors. This process ensures the integrity, relevance and value of our content to our readers.


