





Ethereum faces a break below $1,700 as selling pressure and market uncertainty combine to test support levels not seen since the depth of the previous correction. The price action is alarming, but CryptoOnchain data has applied a sophisticated analytical framework to the current market structure and arrived at a classification that directly challenges the bearish interpretation provided by the price chart.
A four-state Hidden Markov model trained on 336 days of Ethereum on-chain data classified the current market regime as neutral and accumulating – with 99.6% confidence in this classification and an 88.7% probability that the regime will persist rather than shift to a more bearish state. The model does not describe a distribution or capitulation market. It describes a market in a specific structural phase that has historically preceded recovery rather than continued decline.
The Binance metrics that inform this classification tell the story accurately. Open interest on Binance stands at 5.68 billion – the lowest figure in the entire data set and below the average of 6.11 billion for this specific regime. Leveraged positions unwind quietly rather than collapsing violently. The funding rate at 0.0087% is effectively stable: neither bulls nor bears pay a premium to maintain directional exposure.
The pattern’s reading of Ethereum below $1,700 is not a panic. This is not a distribution. This is a market that stopped acting and started waiting – and the distinction between these two states is what CryptoOnchain analysis is designed to identify.
99.6% Confidence in Ethereum Accumulation
The CryptoOnchain report identifies the single variable that separates the current accumulation regime from the recovery phase that would follow it. The Coinbase Premium Gap sits at -2.73, which is significantly more negative than this regime’s historical average of -1.57. The recovery and basing regime that preceded Ethereum’s previous significant advances averaged +0.99 on this metric.
The distance between the current gap and where it needs to be for a regime transition is the most accurate measure available of how far U.S. institutional demand still has to travel before the structural conditions for recovery are in place.

Ethereum Market Regime Detection | Source: CryptoQuant
Comparing regimes adds historical context that makes transition conditions credible rather than speculative. Ethereum’s last significant bull run in the dataset was characterized by relatively low funding rates, averaging 0.0015% and modest open interest of 6.19 billion – not leverage-driven euphoria but demand-driven organic expansion. The next real bull phase will likely occur in the same way rather than through excess derivatives.
The regime persistence probability of 88.7% means that the current accumulation structure is rigid. The transition will not be rapid or random. Two specific conditions must align before the model can classify a regime change. The Coinbase Premium Gap is expected to return towards zero or positive – confirming that US cash demand has returned to a meaningful scale. Open interest on Binance is expected to grow gradually without a corresponding increase in funding rates, confirming that the expansion is driven by demand rather than leverage.
Until both conditions emerge simultaneously, Ethereum remains in a low-conviction accumulation zone with slight structural selling pressure. The model says the bottom is forming. Coinbase Premium indicates that the catalyst has not yet arrived.
Ethereum remains under intense pressure on the weekly timeframe, with the price trading around $1,670 after losing over 16% this week alone. The chart shows a decisive break below the long-standing $1,800-$1,900 support area that contained the price for much of the first half of 2026. More importantly, ETH has now fallen below the February low near $1,750, invalidating a key support level that many bulls were defending as the last major bottom before a deeper correction.
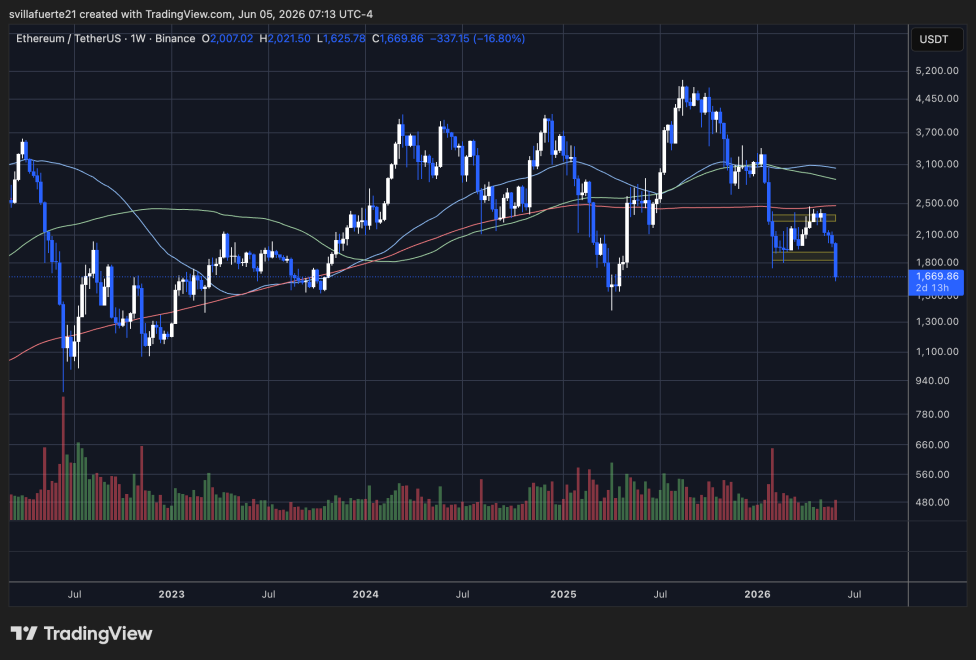
Ethereum loses key demand level | Source: ETHUSDT chart on TradingView
The technical structure has deteriorated considerably. The price is trading below the 50, 100 and 200 week moving averages, confirming a fully bearish trend on all major time frames. The rejection of the $2,200-$2,300 resistance zone in May marked a low against previous rallies, and the subsequent breakout accelerated the downside momentum rather than producing consolidation.
Volume increased during the sale, suggesting that the decline is accompanied by active participation rather than a lack of buyers. This increases the importance of the current region around $1,600 to $1,700, which now represents the first major support area visible on the chart.
If ETH fails to stabilize here, the next significant downside target is near the 2023-2024 consolidation zone, around $1,400-$1,500. For the bulls, reclaiming the broken $1,800 level is now critical. In the meantime, the weekly chart continues to favor sellers, with lower highs and lower lows and momentum firmly tilted to the downside.
Featured image from ChatGPT, chart from TradingView.com
Editorial process as Bitcoinist focuses on providing thoroughly researched, accurate and unbiased content. We follow strict sourcing standards and every page undergoes careful review by our team of top technology experts and seasoned editors. This process ensures the integrity, relevance and value of our content to our readers.


