




Ethereum has lost the $2,000 support level, a development that marks a significant deterioration in the rally that had been building since the February lows. Crossing this psychological threshold has increased concerns in the market – and a CryptoQuant analyst has identified a development in on-chain data that adds a layer of structural context to the current weakness that goes beyond the price action itself.
The signal identified by the analyst is not one that typically appears in traditional market commentary, but its implications for Ethereum’s near-term supply dynamics are direct and measurable. Recent on-chain data suggests that Ethereum’s number of failed transactions may be trending upward. At the same time, foreign exchange inflows appear to show a slight but gradual increase alongside this trend.
Failed transactions on a blockchain network are not simple technical errors. They represent an attempted activity that the network has processed without completing it, and their frequency contains information about the nature of the request that is currently interacting with the Ethereum network. When the number of failed trades increases in a specific context, it may reflect a market under stress, with participants attempting to execute trades at speeds or gas levels that current network conditions do not allow.
The combination of increasing failed trades and increasing exchange flows is the pair that the CryptoQuant analyst flagged as worth looking into – because together they can describe a market dynamic that the price chart is only beginning to reflect.
Rising FX Flows and Directionless Price
The CryptoQuant analyst connects the three data points into a coherent short-term assessment that each indicator alone would not fully support. Ethereum price is consolidating primarily in a sideways motion – not collapsing aggressively, but also not demonstrating the directional momentum that would suggest the breakout of $2,000 support was a temporary overextension rather than a structural change.

Ethereum price with Exchange Inflow and failed transaction count | Source: CryptoQuant
In the face of this uncontrolled price action, the increase in the number of failed transactions describes friction on the network that reflects stress rather than organic business growth. Failed transactions consuming gas without doing useful work are not the signature of a network experiencing healthy demand – it is the signature of a market where participants compete for block space under conditions of uncertainty, rush transactions at inappropriate gas levels, or attempt arbitrage and liquidation activities that speak more to volatility management than true utility expansion.
The gradual increase in foreign exchange flows aggravates the situation. Coins heading to exchanges in a period of price weakness and network friction depict participants narrowing their time horizon – moving from self-custody positions to places where assets can be sold quickly if conditions deteriorate further.
The analyst’s short-term assessment is a direct result of the grouping. Nothing here independently confirms a bearish result: a sideways price move can precede a recovery as easily as a decline, and moderate FX inflows are not widely distributed. But the convergence of network frictions, increased liquidity linked to exchanges, and lack of directional momentum create a setup that the broader Ethereum landscape currently does little to compensate for. Until failed trade trends reverse and FX flows stabilize, the data supports a cautious near-term outlook rather than one that anticipates an imminent recovery above $2,000.
Ethereum Loses Critical Support as Market Structure Weakens
Ethereum fell below the psychological $2,000 level, confirming a significant deterioration in the recovery structure that had developed since the February lows. The daily chart shows that ETH failed to hold the key support cluster around $2,050 to $2,100, an area that previously provided the basis for the rebound in April and early May.
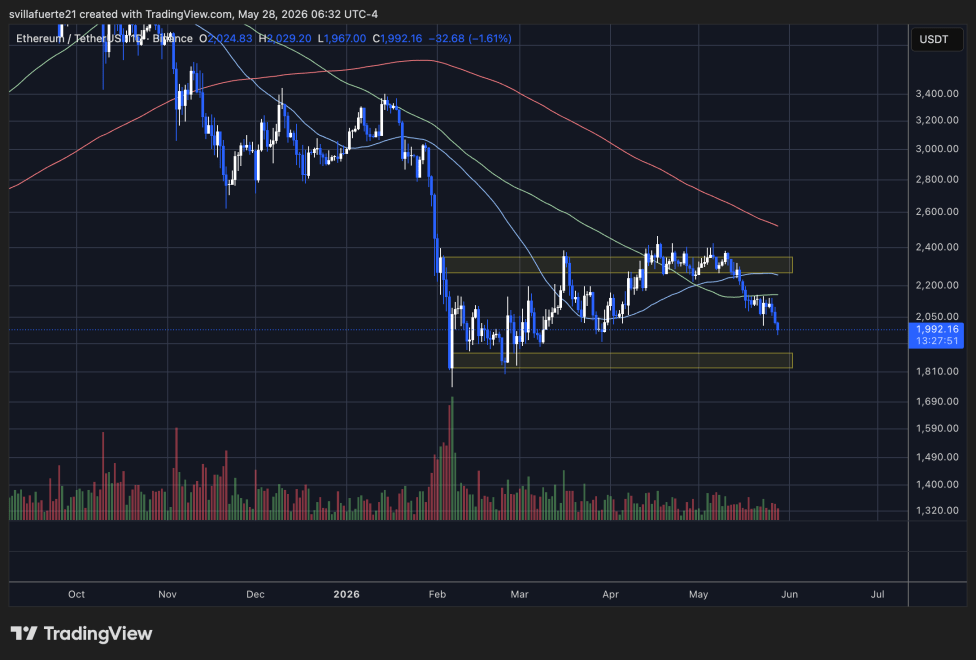
Ethereum losing momentum below $2,000 | Source: ETHUSDT chart on TradingView
Technically, the breakup shifts momentum back in favor of sellers. ETH is now trading below the short-term moving averages, while the 100-day moving average continues to act as dynamic resistance near the $2,150 region. More importantly, the rejection of the major resistance zone between $2,250 and $2,350 confirmed that the bulls did not have the strength to resume the broader macro trend.
The structure also began to form lower highs after the May peak, a classic sign of weakening demand during recovery attempts. The recent decline accelerated once ETH lost the 50-day moving average, triggering another wave of selling pressure that pushed the price towards the lower demand zone between $1,800 and $1,850.
As long as Ethereum remains below the $2,050-$2,100 zone, the market structure continues to favor downside risk and prolonged consolidation rather than immediate bullish continuation.
Featured image from ChatGPT, chart from TradingView.com
Editorial process as Bitcoinist focuses on providing thoroughly researched, accurate and unbiased content. We follow strict sourcing standards and every page undergoes careful review by our team of top technology experts and seasoned editors. This process ensures the integrity, relevance and value of our content to our readers.


