





Ethereum has lost more than 12% of its value over the past ten days as selling pressure crushed the rally that briefly took the asset towards $2,400. The decline was sustained and steady – not a single sharp event, but a series of lower highs and lower lows that eroded the confidence built during weeks of cautious recovery. In this context, an analysis of the Arabic channel that tracks Binance derivatives activity has identified a signal that introduces a layer of complexity to the frankly bearish reading that price action currently suggests.
Ethereum open interest on Binance has climbed to around $5.5 billion – above the 30-day average of around $5.34 billion – as the price stabilizes near $2,110. The Z-Score measuring the deviation of current open interest from its recent historical norm has increased to around 0.62, reflecting a notable increase in speculative activity relative to the benchmark that has defined derivatives market behavior in recent weeks.
The timing of this return creates the analytical tension examined by the Arab Channel report. The return of speculative activity to the Ethereum derivatives market as the price loses ground is not the pattern described by simple bearish momentum. Momentum-driven declines typically cause derivatives activity to collapse alongside prices – participants reduce exposure, leverage decreases, interest contracts are opened.
The data shows something different. And what it shows at $2,110 might be the most important signal the Ethereum derivatives market has produced since the selling pressure began.
Derivatives wake up as price holds at $2,000
The Arab Channel’s report traces the recovery in open interest rates back to its starting point to give the current reading its full context. ETH derivatives activity on Binance has gradually increased since March – a sustained directional trend that has developed alongside the recovery in prices from the February lows and the gradual return of liquidity to the market. The current figure above the 30-day average is not a sharp spike but a continuation of a trend that has been building for months.

Binance: ETH Open Interest Z-Score | Source: CryptoQuant
The Z-score, at 0.62, is in moderate territory – above the baseline that has characterized the weakest periods of activity in recent months, but well below the high values that historically signal excessive speculation or crowded positioning. This positioning on the spectrum is important. A market with moderate and improving derivative activity is structurally different from a market where open positions are increasing aggressively – the former describes stake rebuilding, the latter describes the type of excess that precedes liquidation cascades.
The prospective implication identified by the report is conditional in both directions. The rise in open interest and price stability above $2,000 suggests that new positions are being established – with participants expressing directional conviction rather than simply maintaining existing exposure. When this dynamic develops alongside real capital inflows into the spot market, it tends to precede stronger and more sustained price movements, as derivatives and spot demand reinforce each other.
The risk that the analysis preserves is just as specific. Leveraged rebuilding without the corresponding strength of the spot market creates fragility rather than a foundation – a derivatives structure that amplifies any move that subsequently occurs without the underlying demand to give that move sustainability. The Z-Score at 0.62 does not yet indicate this fragility. Its development in this direction or its constructive resolution depends on the actual arrival of the spot demand anticipated by the derivatives activity.
Ethereum Tests Critical Support as Momentum Continues to Fade
Ethereum remains under sustained pressure after losing momentum near the $2,400 region, with the daily chart now showing a clear deterioration in the short-term structure. ETH is currently trading around $2,110, directly on a critical support zone that bulls have repeatedly defended since late March.
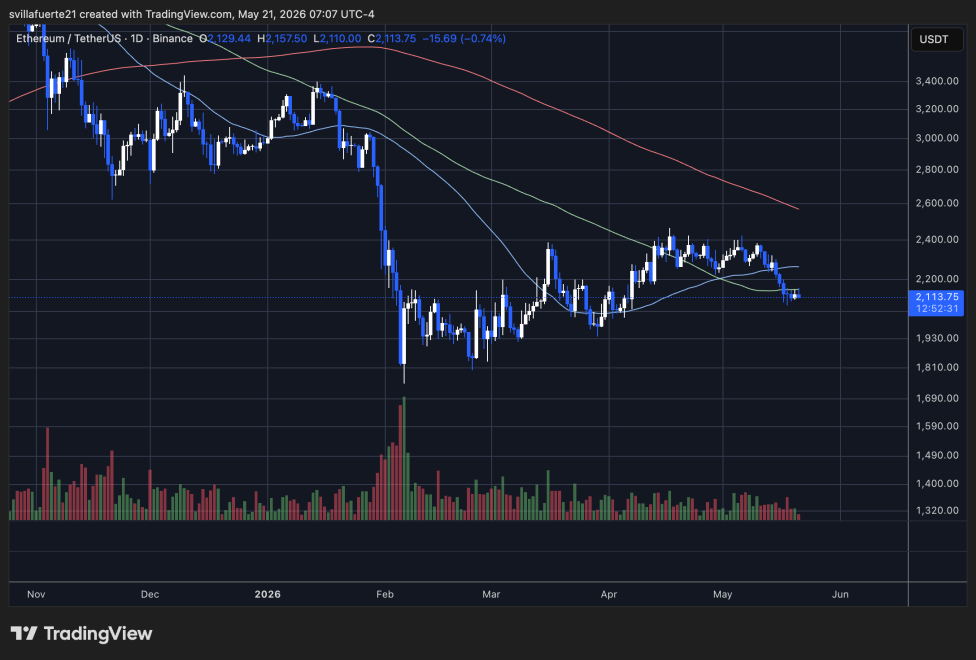
Ethereum consolidates below the $2,150 level | Source: ETHUSDT Chart on TradingView
The chart reveals a gradual but consistent pattern of lower highs since May’s local peak, signaling weakening buying strength as each recovery attempt loses strength faster than the last. The price has also fallen below the short-term moving averages, while the 200-day moving average near $2,500 continues to decline, reinforcing the broader bearish structure.
Related Reading: Bitcoin Is Stuck Between Two Tiers of Powerful Holders: Key Data Clears Setup
An important detail is the declining volume profile during the recent retracement. Unlike the aggressive capitulation seen during February’s sharp decline, the current decline appears more controlled and less driven by panic. This suggests that the market is experiencing careful risk distribution and reduction rather than complete liquidation.
The $2,080-$2,100 area now becomes the key level to watch. Maintaining this zone could allow Ethereum to stabilize and attempt a further recovery towards $2,300. However, a confirmed break below support would expose the market to a deeper move towards the $1,900 region, where buyers had moved in aggressively following February’s capitulation low.
Featured image from ChatGPT, chart from TradingView.com
Editorial process as Bitcoinist focuses on providing thoroughly researched, accurate and unbiased content. We follow strict sourcing standards and every page undergoes careful review by our team of top technology experts and seasoned editors. This process ensures the integrity, relevance and value of our content to our readers.


