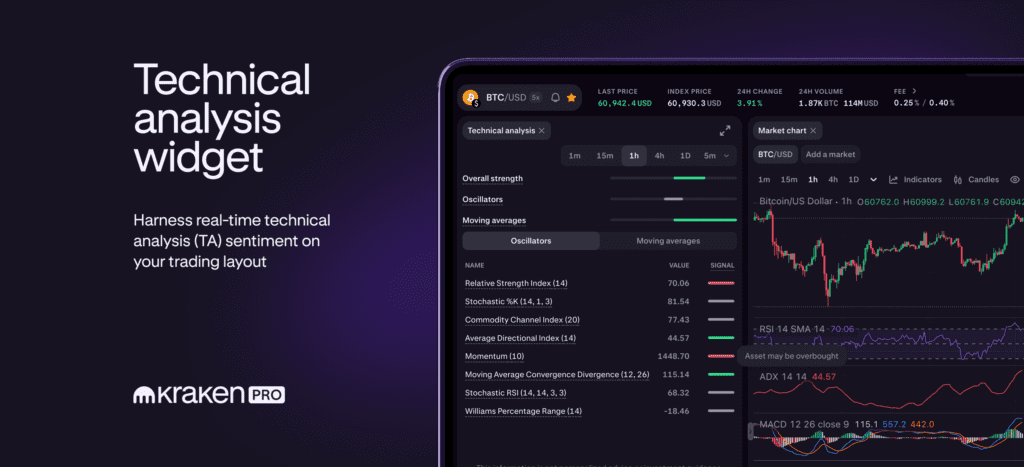
Follow live market signals for 22 technical analysis oscillators and moving averages on your Kraken Pro layout.

Kraken Pro is excited to introduce a new comprehensive tool to our web trading interface: the Technical Analysis (TA) widget. This feature provides real-time market signals for 22 technical analysis oscillators and moving averages, allowing you to make more informed decisions by detecting oversold or overbought market conditions directly in your trading layout.
The Technical Analysis widget is designed to seamlessly integrate with your customizable Kraken Pro layout, providing detailed insights into market sentiment across two main categories: oscillators and moving averages. Whether you’re assessing the momentum of a price move or identifying potential reversal signals, this widget has you covered:
- Dual tabs for easy navigation: Switch between the Oscillators and Moving Averages tabs to view different sets of indicators.
- Signal Overview: At the top of the widget, monitor the overall market sentiment.
- Flexible selection of time period: Customize the time frame of your indicators, with options ranging from 1 minute to 1 day to match your trading strategy.
- Dynamic updates: All sentiment values and indicators are updated in real-time as you adjust time periods, providing you with the most up-to-date data across all time periods.
4 hours $BTC Oscillators displaying mixed signals 🟥🟩
What is your prediction for today? pic.twitter.com/TIeZWWYoFO
— Kraken Pro (@krakenpro) August 1, 2024
Dive into oscillators and moving averages
Understanding the specific tools available in the TA widget is essential to exploiting its full potential.
Pro tip: Learn more about technical analysis indicators with our new in-product learning content here.
Below are tables summarizing the oscillators and moving averages you can follow:
Oscillators

| Indicator | Code | Description |
| Relative Strength Index (14) | RSI | The Relative Strength Index momentum oscillator measures the strength of price movement, helping to identify overbought or oversold markets. |
| Stochastic Oscillator (14, 1, 3) | STOC | Stochastic %K predicts price turning points by comparing the current price against the high-low range over a specific period. |
| Commodity Channel Index (20) | CCI | The commodity index measures the variation of an asset relative to its statistical average, helping to identify new trends or warn of extreme conditions. |
| Average Directional Index (14) | ADI | The Average Directional Index quantifies the strength of the trend regardless of the direction of the trend by combining two directional indicators, the positive (+DI) and the negative (-DI) to assess the strength of the current trend relative to past trends. |
| Momentum (10) | ADX | The momentum indicator measures the speed at which the price of an asset changes, by comparing the current closing price to previous closing prices to gauge the speed of price movements. |
| Moving average convergence-divergence (12, 26) | MACD | Moving Average Convergence Divergence is a momentum indicator that reveals changes in the strength, direction, momentum, and duration of a price trend. |
| Stochastic RSI (14) | STOCH RSI | Fast Stochastic RSI provides faster signals using shorter time frames, making it ideal for identifying overbought and oversold conditions in faster moving markets. |
| Williams Percentage Range (14) | %R | Williams Percentage Range is a momentum indicator that measures overbought and oversold markets by comparing an asset’s closing price to the high-low range over a given period. |
Moving averages

| Indicator | Code | Description |
| Simple Moving Average (10, 20, 30, 50, 100, 200) | SMA | Simple moving average is a smoothing method used to average price data over a period of time, helping to identify trends and potential support or resistance levels. |
| Exponential Moving Average (10, 20, 30, 50, 100, 200) | EMA | An exponential moving average indicator calculates the average price of a market over a certain period of time. Unlike the simple moving average, which gives all prices equal weight, the EMA gives priority to recent prices, making it more responsive to recent price movements. |
| Hull moving average (9) | HMA | Hull Moving Average aims to reduce latency by combining the weighted moving average with the square root of the period, making it very responsive to changes in price movement. |
| Volume Weighted Moving Average (20) | VWMA | The volume-weighted moving average is a smoothing indicator that incorporates both price and volume to reflect the average price of an asset, weighted by its trading volume over a specific period. |
Check out the new TA widget on Kraken Pro and take your trading to the next level with real-time, data-driven insights. Happy trading!
These materials are provided for general informational purposes only and do not constitute investment advice, or a recommendation or solicitation to buy, sell, stake, or hold any cryptoassets, or to participate in any specific trading strategy. Kraken makes no representations or warranties, express or implied, as to the accuracy, completeness, timeliness, suitability, or validity of this information and will not be liable for any errors, omissions, or delays in this information or for any losses, injuries, or damages resulting from the display or use of it. Kraken does not and will not work to increase or decrease the price of any particular cryptoasset that it makes available. Certain crypto products and markets are unregulated and you may not be protected by government compensation and/or regulatory protection schemes. The unpredictable nature of the cryptoasset markets may result in the loss of funds. Tax may be payable on any return and/or increase in the value of your crypto assets and you should seek independent advice on your tax position. Geographic restrictions may apply.


