- Fantom’s momentum was in overbought territory, at press time, and could see a pullback.
- Strong demand during $1 breakout was a long-term bullish sign
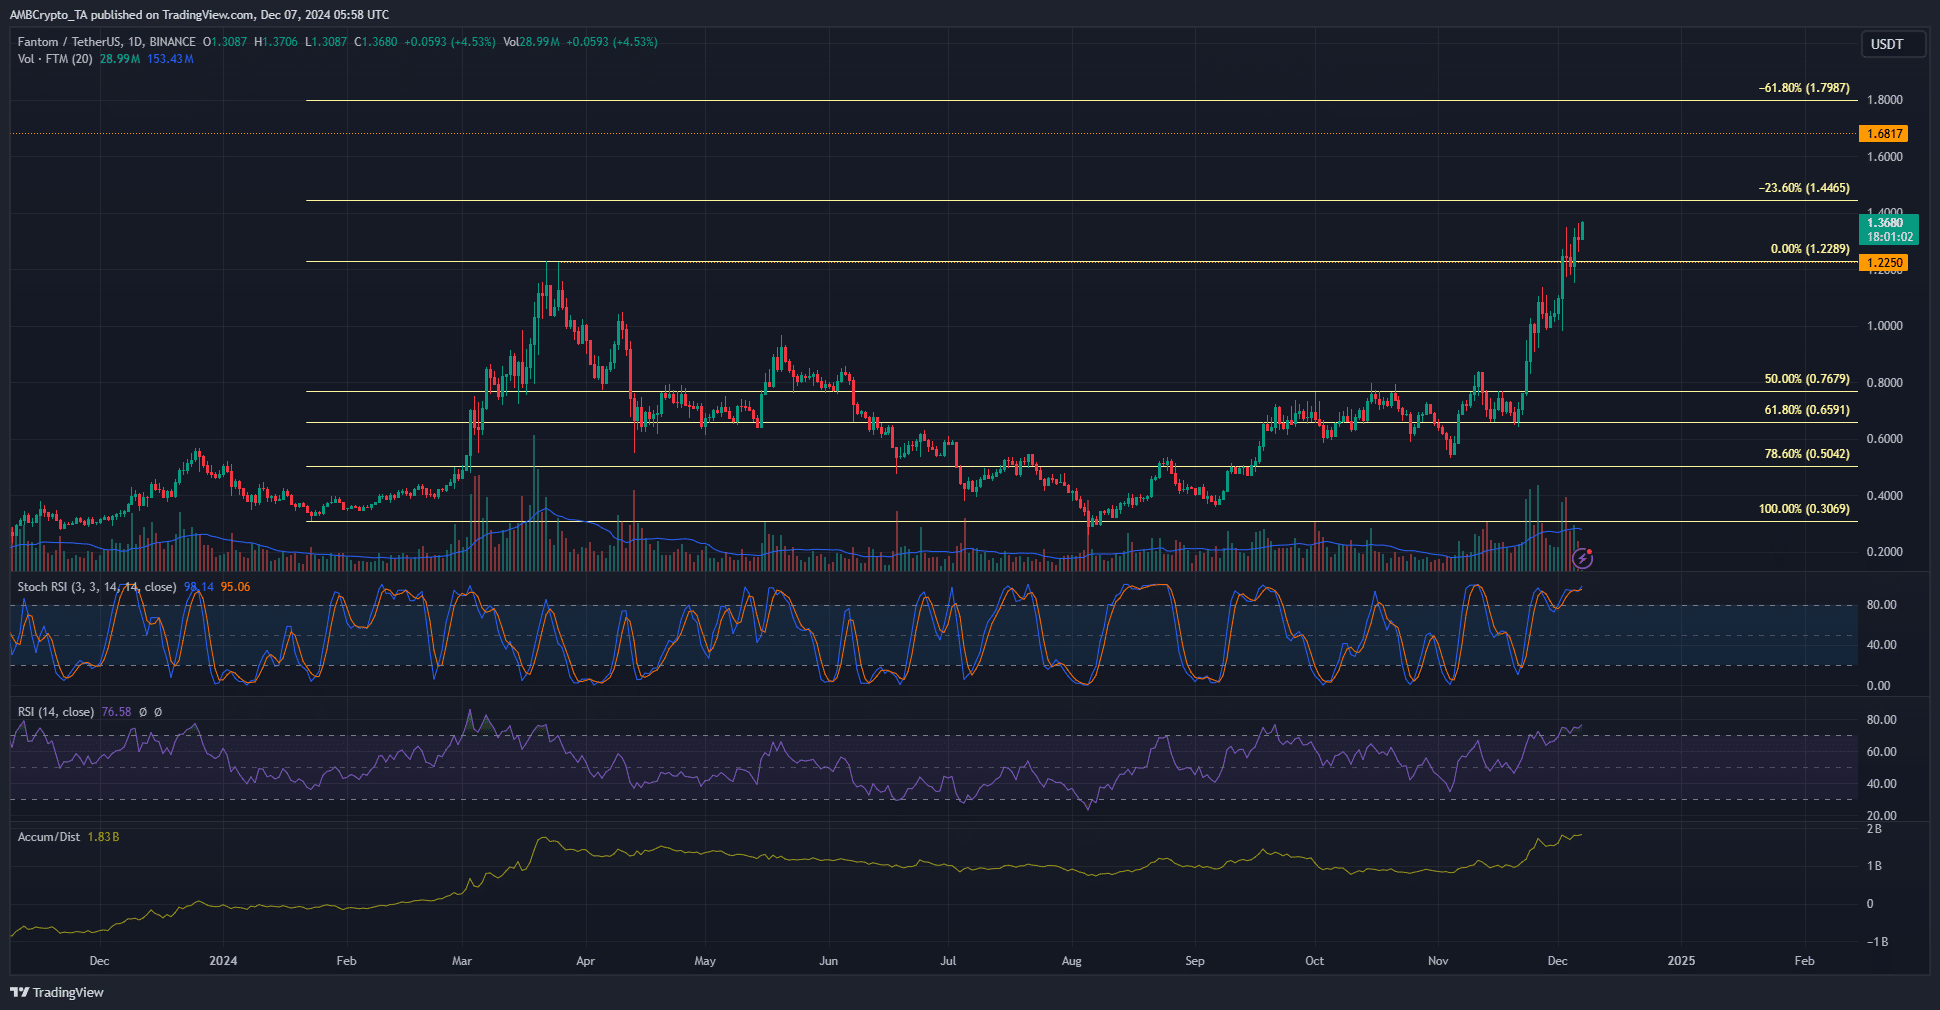
Fantom (FTM) bulls managed to reclaim the $1.22 level as support and possessed the strength to push the price even higher. FTM can be expected to test the $1.44-$1.5 resistance zone soon.
With Bitcoin (BTC) early in its run and recently surpassing $100,000, further gains can be expected in the altcoin market in the coming months.
Is it time for an FTM withdrawal?

Source: FTM/USDT on TradingView
On the daily chart, the breakout of the $1 level significantly strengthened the bullish belief. The same level was retested as support on November 28. During this breakout, trading volume increased to reflect the buying pressure behind FTM.
The A/D indicator was boosted by the increase in trading volume. The indicator reflected increased demand as the price of Fantom continued to rise. Over the past five days, the $1.22 level has also moved towards support.
This was the March high before the altcoin fell into a six-month downtrend. The next resistance levels were at $1.44, $1.68, and $1.79.
The Stochastic RSI was in overbought territory, as was the RSI on the daily chart. This does not suggest an immediate pullback, but can be interpreted as a sign that the market may be overextended. In fact, it’s up 105% in just over two weeks.
Resistance at the 23.6% extension level at $1.44 could push back the bulls temporarily.
Speculative interest continued to grow


Source: Coinalyse
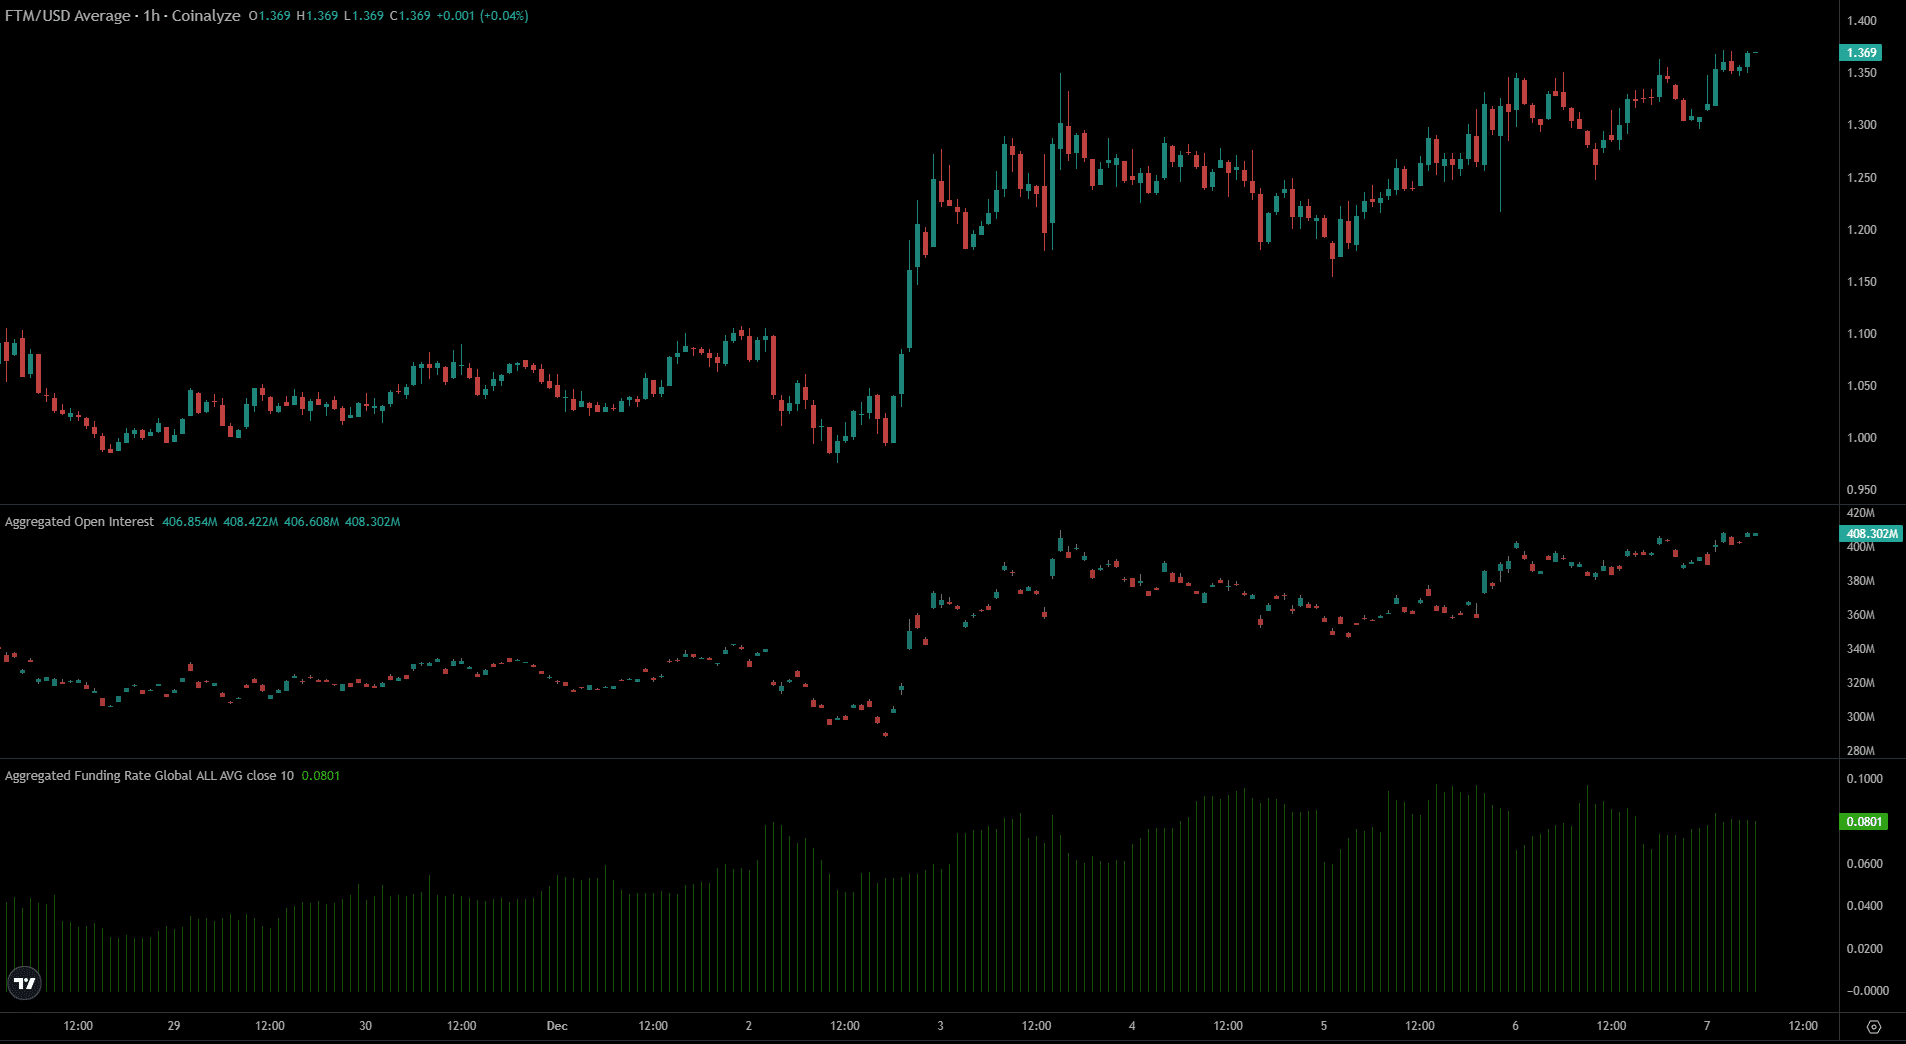
FTM open interest has also increased, along with the price. This indicates strong bullish sentiment in the futures market.
Read Fantom (FTM) Price Prediction 2024-25
The funding rate has gradually increased over the past week, showing a greater disparity between spot and futures prices. This divergence was driven by an uptick in speculative participants and is a sign of short-term bullish conviction.
Disclaimer: The information presented does not constitute financial, investment, business or other advice and represents the opinion of the author only.


