Close Menu
Altcoin ObserverAltcoin Observer
  • Regulation
  • Bitcoin
  • Altcoins
  • Market
  • Analysis
  • DeFi
  • Security
  • Ethereum
Categories
  • Altcoins (3,581)
  • Analysis (3,687)
  • Bitcoin (4,312)
  • Blockchain (2,157)
  • DeFi (2,623)
  • Ethereum (2,758)
  • Event (119)
  • Exclusive Deep Dive (1)
  • Landscape Ads (2)
  • Market (2,714)
  • Press Releases (12)
  • Reddit (2,847)
  • Regulation (2,474)
  • Security (4,000)
  • Thought Leadership (3)
  • Videos (44)
Hand picked
  • KAITO Moves $10.33 Million in Tokens – Can Bulls Push Price to $0.65?
  • Mike Novogratz highlights his role as pilot of June Crypto M
  • AstroX Finance and Magne.AI partner on Token-Mobile integration
  • XRP Ripple ETF Inflows Hit $1.35 Billion: Why Has XRP Price Not Broken Out?
  • RaveDAO: Why RAVE’s 20% Rally Has a KEY Difference This Time
We are social
  • Facebook
  • Twitter
  • Instagram
  • YouTube
Facebook X (Twitter) Instagram
  • About us
  • Disclaimer
  • Terms of service
  • Privacy policy
  • Contact us
Facebook X (Twitter) Instagram YouTube LinkedIn
Altcoin ObserverAltcoin Observer
  • Regulation
  • Bitcoin
  • Altcoins
  • Market
  • Analysis
  • DeFi
  • Security
  • Ethereum
Events
Altcoin ObserverAltcoin Observer
Home»Bitcoin»FTM 2-Week Price Trend – Up 105%, But Is a Pullback Coming?
Bitcoin

FTM 2-Week Price Trend – Up 105%, But Is a Pullback Coming?

December 7, 2024No Comments
Share Facebook Twitter Pinterest LinkedIn Tumblr Reddit Telegram Email
Ftm Featured 1000x600.webp.webp
Share
Facebook Twitter LinkedIn Pinterest Email


  • Fantom’s momentum was in overbought territory, at press time, and could see a pullback.
  • Strong demand during $1 breakout was a long-term bullish sign

Fantom (FTM) bulls managed to reclaim the $1.22 level as support and possessed the strength to push the price even higher. FTM can be expected to test the $1.44-$1.5 resistance zone soon.

With Bitcoin (BTC) early in its run and recently surpassing $100,000, further gains can be expected in the altcoin market in the coming months.

Is it time for an FTM withdrawal?

Fantom 1-day chart

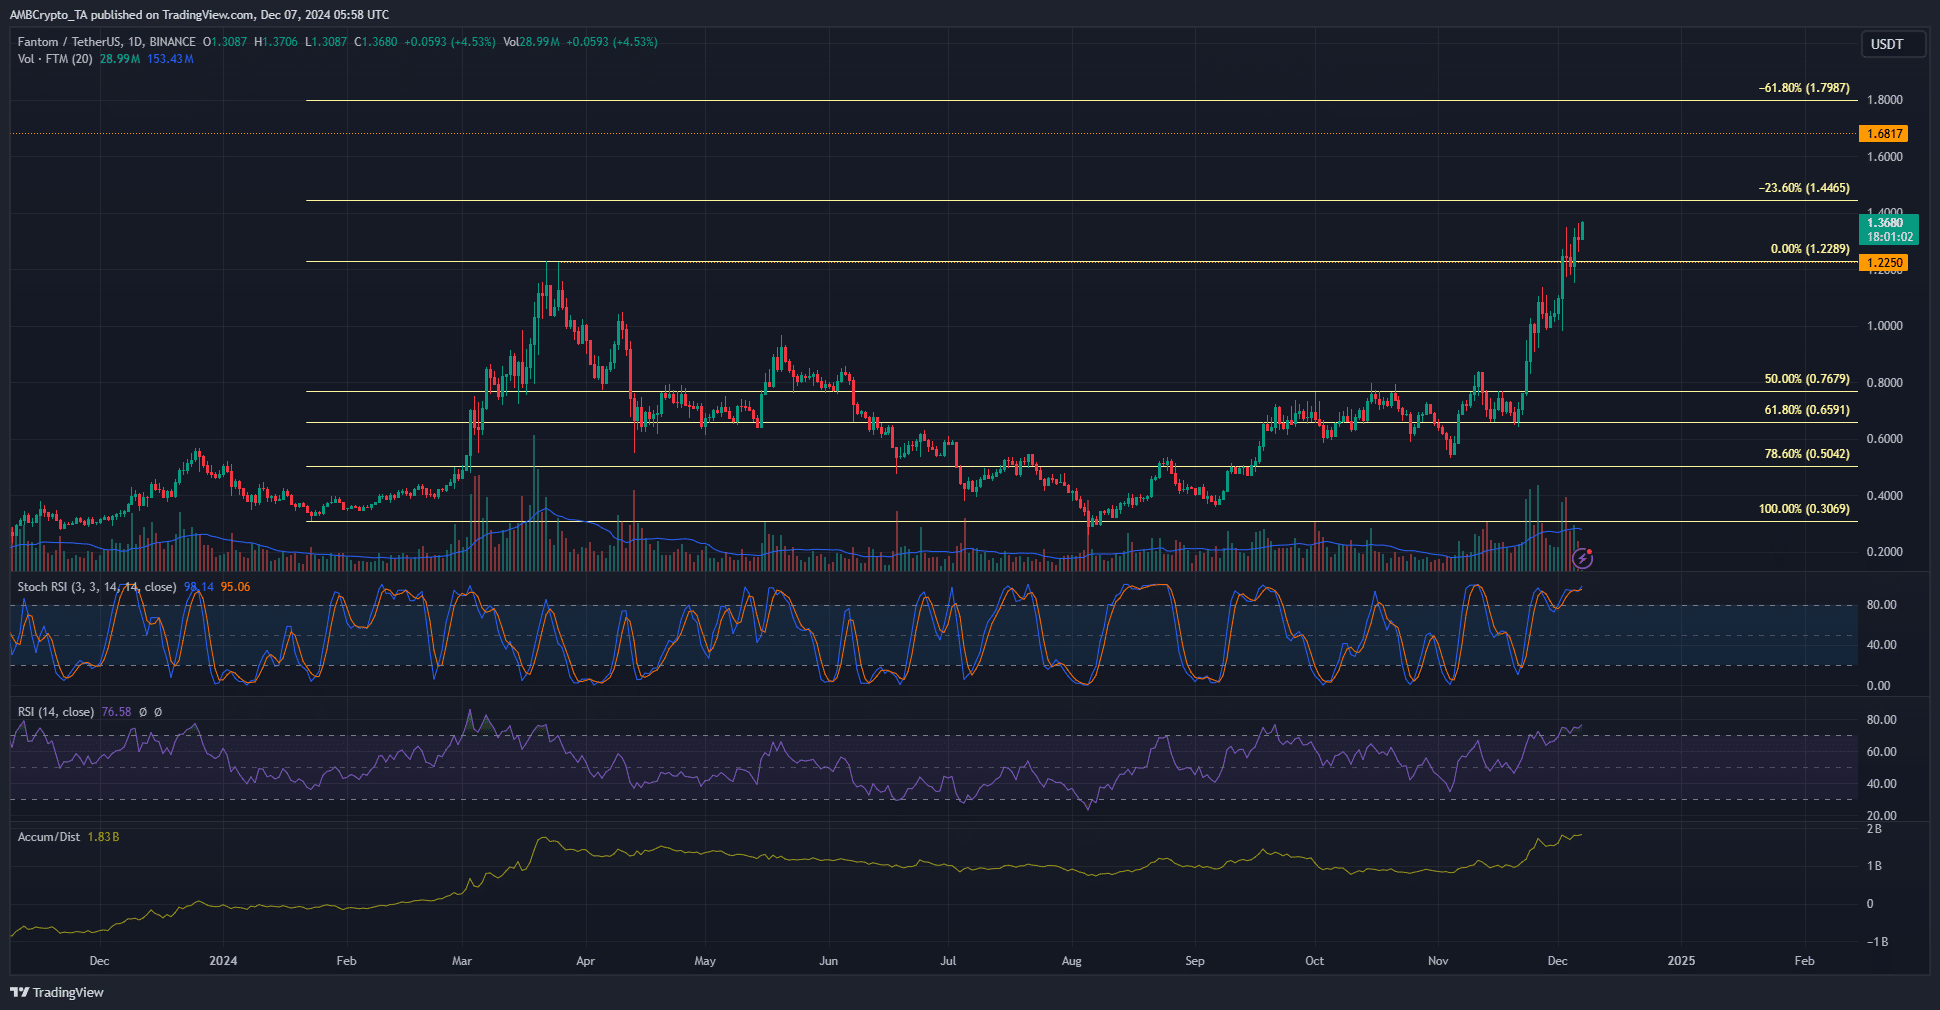
Source: FTM/USDT on TradingView

On the daily chart, the breakout of the $1 level significantly strengthened the bullish belief. The same level was retested as support on November 28. During this breakout, trading volume increased to reflect the buying pressure behind FTM.

The A/D indicator was boosted by the increase in trading volume. The indicator reflected increased demand as the price of Fantom continued to rise. Over the past five days, the $1.22 level has also moved towards support.

This was the March high before the altcoin fell into a six-month downtrend. The next resistance levels were at $1.44, $1.68, and $1.79.

The Stochastic RSI was in overbought territory, as was the RSI on the daily chart. This does not suggest an immediate pullback, but can be interpreted as a sign that the market may be overextended. In fact, it’s up 105% in just over two weeks.

Resistance at the 23.6% extension level at $1.44 could push back the bulls temporarily.

Speculative interest continued to grow
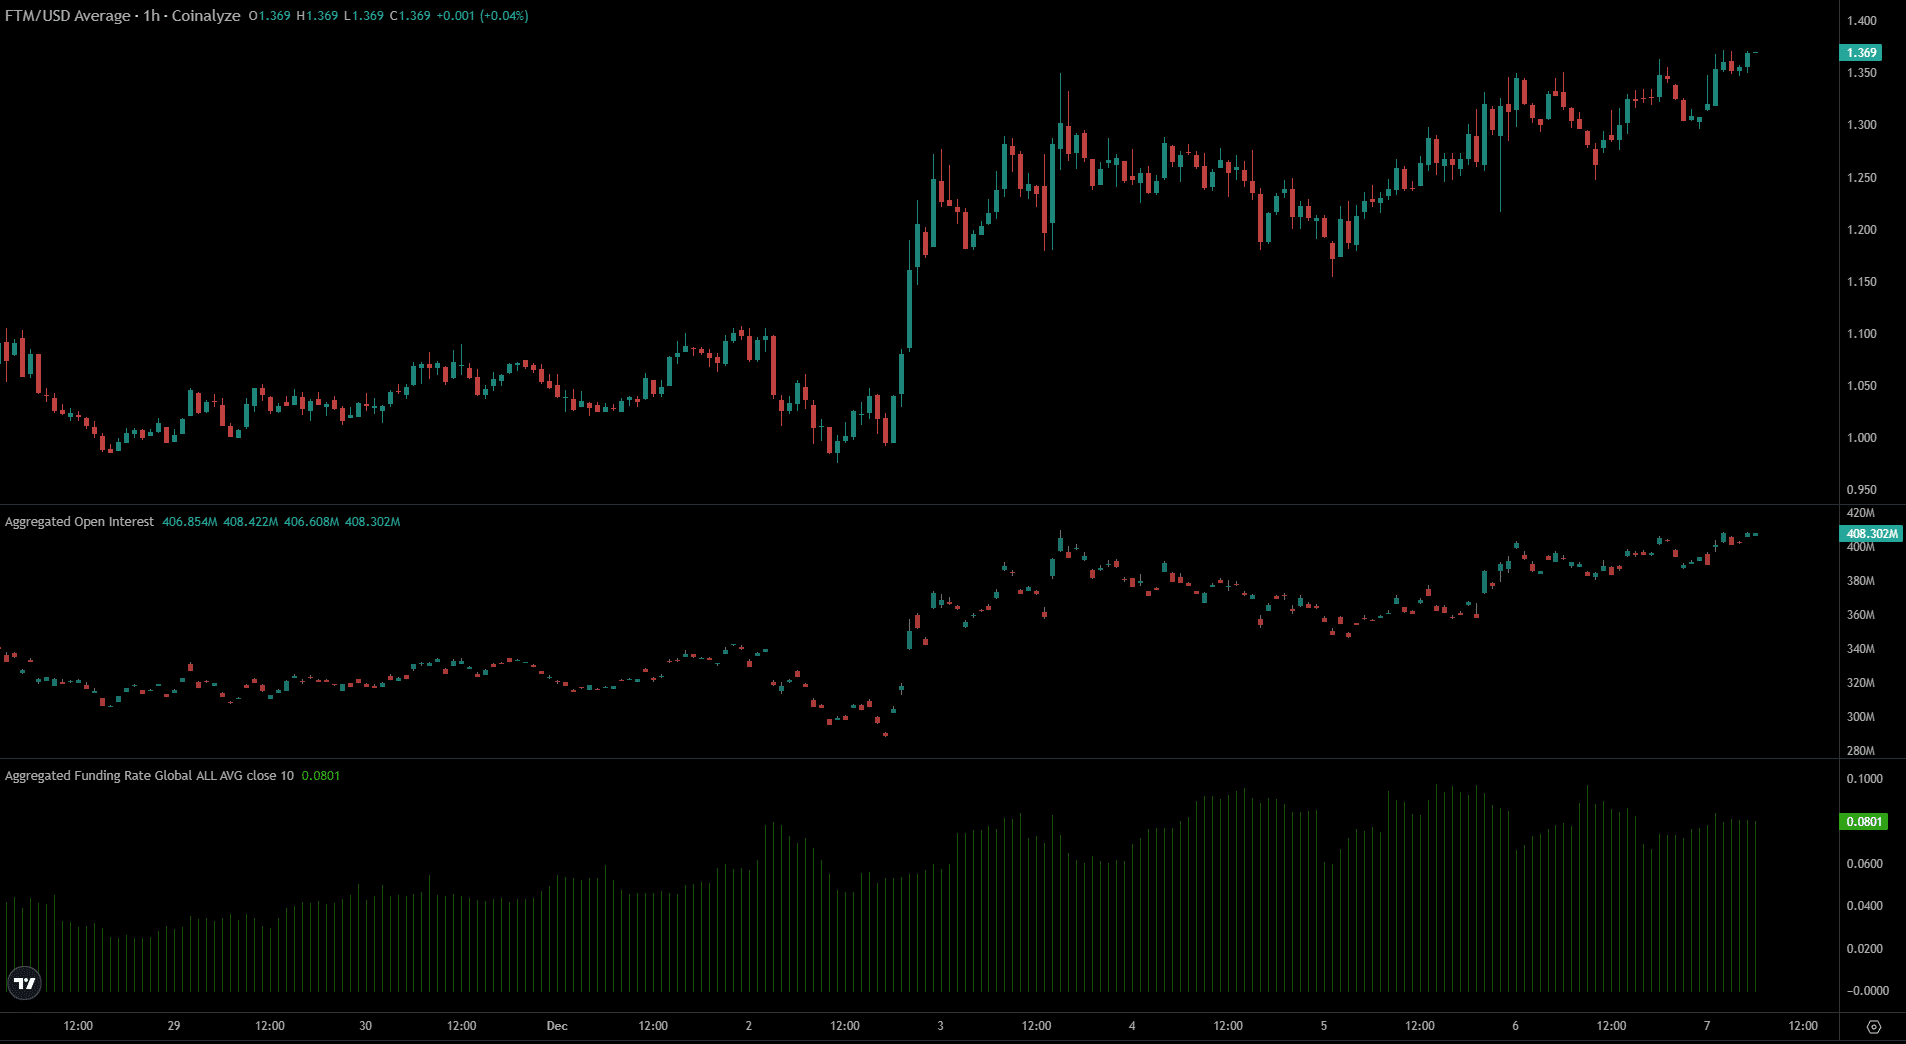
Fantom CoinalyseFantom Coinalyse

Source: Coinalyse

FTM open interest has also increased, along with the price. This indicates strong bullish sentiment in the futures market.


Read Fantom (FTM) Price Prediction 2024-25


The funding rate has gradually increased over the past week, showing a greater disparity between spot and futures prices. This divergence was driven by an uptick in speculative participants and is a sign of short-term bullish conviction.

Disclaimer: The information presented does not constitute financial, investment, business or other advice and represents the opinion of the author only.

Next: Bitcoin Whales Recover 20,000 BTC Worth $2 Billion in 24 Hours – Impact?


Source link

Share. Facebook Twitter Pinterest LinkedIn Tumblr Email
Previous ArticleFTM 2-Week Price Trend – Up 105%, But Is a Pullback Coming?
Next Article Indicators Point to Massive Upside for Dogecoin (DOGE) and This New DeFi Coin as Solana (SOL) Eyes $500

Related Posts

Bitcoin

XRP Ripple ETF Inflows Hit $1.35 Billion: Why Has XRP Price Not Broken Out?

June 29, 2026
Bitcoin

Binance Coin Consolidates Near Local Su

June 28, 2026
Bitcoin

Bitcoin Is Currently Cheaper Than 90% of Its History, Says Lawrence Lepard, Author of Big Print

June 28, 2026
Add A Comment
Leave A Reply Cancel Reply

Single Page Post
Share
  • Facebook
  • Twitter
  • Instagram
  • YouTube
Featured Content
Event

Dutch Blockchain Week 2026 strengthens position as Europe’s leading B2B blockchain event week

April 14, 2026

Amsterdam, April 2026 – Dutch Blockchain Week 2026 is rapidly evolving into one of Europe’s…

Event

Global Games Show Riyadh: The Ultimate Creator & Influencer Hub

March 31, 2026

The fast-evolving gaming ecosystem of Riyadh is powered by solid national investment, a flourishing esports…

1 2 3 … 82 Next
  • Facebook
  • Twitter
  • Instagram
  • YouTube

KAITO Moves $10.33 Million in Tokens – Can Bulls Push Price to $0.65?

June 29, 2026

RaveDAO: Why RAVE’s 20% Rally Has a KEY Difference This Time

June 28, 2026

SKYAI hits its lowest month after a 36% drop – Yet THIS group is not going backwards

June 28, 2026
Facebook X (Twitter) Instagram LinkedIn
  • About us
  • Disclaimer
  • Terms of service
  • Privacy policy
  • Contact us
© 2026 Altcoin Observer. all rights reserved by Tech Team.

Type above and press Enter to search. Press Esc to cancel.

bitcoin
Bitcoin (BTC) $ 59,834.00
ethereum
Ethereum (ETH) $ 1,578.30
tether
Tether (USDT) $ 0.998354
bnb
BNB (BNB) $ 552.04
usd-coin
USDC (USDC) $ 0.999606
xrp
XRP (XRP) $ 1.05
solana
Solana (SOL) $ 72.28
tron
TRON (TRX) $ 0.321855
figure-heloc
Figure Heloc (FIGR_HELOC) $ 1.04
staked-ether
Lido Staked Ether (STETH) $ 2,265.05