


This article is an excerpt from our 2024 Crypto Geography Report. Download your copy now!
We are excited to share the fifth annual Chainalysis Global Crypto Adoption Index. In each year’s report, we examine on-chain and off-chain data to determine which countries are leading the world in grassroots crypto adoption. Our research highlights countries where unique cryptocurrency use cases are taking hold and explores why people in countries around the world are adopting crypto.
Keep reading to learn more about:
Our Global Crypto Adoption Index methodology
The Global Crypto Adoption Index is made up of four sub-indexes, each based on countries’ use of different types of cryptocurrency services. We rank the 151 countries for which we have sufficient data on each subindex, weight the rankings based on characteristics such as population size and purchasing power, take the geometric mean of each country’s ranking in all four, then let’s standardize this final number on a scale. from 0 to 1 to give each country a score which determines its general ranking. The closer the country’s final score is to 1, the higher its ranking.
In order to calculate our sub-indexes, we estimate countries’ transaction volumes for different types of cryptocurrency services and protocols based on the web traffic patterns of the websites of those services and protocols. We recognize that web traffic data is imperfect, as some cryptocurrency users likely use VPNs and other similar tools to mask their true physical location. However, given that our index represents hundreds of millions of cryptocurrency transactions and over 13 billion web visits, it is likely that any misattributed transaction volume due to VPNs is marginal, given the size of the dataset. We also compare the results with information from local crypto experts and operators around the world, giving us more confidence in this methodology.
Below is a description of the sub-indexes and how they are calculated, as well as improvements to our methodology since last year.
Subindex category 1: on-chain cryptocurrency value received by centralized services, weighted by GDP per capita on a PPP-adjusted basis
We include this subindex to rank each country based on the total value of cryptocurrencies received on centralized services, and weight the ranking to favor countries where this amount is greater relative to the average income of a person in that country . To calculate this, we estimate the total value received on-chain by users of centralized services in each country, and weight it by GDP per capita on a PPP-adjusted basis, which measures the country’s per capita income. The higher the ratio of on-chain value received to GDP per capita on a PPP-adjusted basis, the higher the ranking. In other words, if two countries received equal amounts of cryptocurrency through centralized services, the country with the lower GDP per capita on a PPP-adjusted basis would come out on top.
Subcategory 2: Retail value of on-chain cryptocurrencies received by centralized services, weighted by GDP per capita on a PPP-adjusted basis.
We also estimate the activity of individual non-professional cryptocurrency users in centralized services, based on the value of the crypto they carry relative to the purchasing power of an average person. To do this, we estimate the amount of crypto received in centralized services by users in each country – similar to subindex category 1 – but counting only the value received in retail transactions, which we designate as transactions of crypto worth less than $10,000. We then rank each country based on this measure, but weight it to favor countries with lower GDP per capita on a PPP-adjusted basis.
Subindex category 3: on-chain cryptocurrency value received by DeFi protocols, weighted by GDP per capita on a PPP-adjusted basis
We rank countries based on their DeFi transaction volume and weight the ranking to favor countries with lower GDP per capita on a PPP-adjusted basis.
Subindex Category 4: Value of on-chain retail cryptocurrency received by DeFi protocols, weighted by GDP per capita on a PPP-adjusted basis
We rank each country based on the volume of DeFi transactions made as retail transfers (again, worth less than $10,000 worth of crypto), weighted to favor countries with lower GDP per capita over a PPP-adjusted basis.
Methodology changes
Methodology Change 1: Measuring DeFi Activity
The main change in methodology this year concerns how we measure the value of cryptocurrencies received by decentralized protocols. For DeFi services, we only included value received from suspicious personal wallets and excluded value received by other known DeFi wallets. This new methodology ensures that the total value received is not inflated due to intermediate steps required by some smart contracts.
Here is an example of how DeFi transfers typically work:
- A personal wallet initiates a trade in DeFi Protocol A, transferring Ether (ETH) from the personal wallet to the contract address of the DeFi Protocol A router.
- ETH is deposited to the contract address of the wrapped Ether token (wETH) from the contract address of the router.
- The router contract address receives wETH.
- A transfer follows from the router to the decentralized exchange (DEX) pool contract.
- A transfer follows from the DEX pool contract to the router.
- There is a final transfer from the router to the personal wallet.
Based on our new methodology, we only count the first transfer in the example above to determine the total value received by the DeFi protocol. By doing so, we can eliminate intermediary transfers between contracts belonging to the same service provider. This process has led to a decrease in our estimates of the value received, but it is now a more accurate estimate.
Change in methodology 2: exclusion of the P2P exchanges sub-index
In previous years, we included the trading volume of P2P cryptocurrency exchanges, weighted by PPP per capita and the number of internet users, to calculate the overall crypto adoption ranking. This year, we decided to exclude this subindex due to a substantial drop in activity on P2P exchanges. One of the largest and oldest P2P exchanges, LocalBitcoins.com, shut down last year, contributing to this decline.
The Top 20 in the 2024 Global Crypto Adoption Index
Central, South Asia and Oceania (CSWA) dominates our 2024 index, with seven of the top 20 countries located in the region. As we explain in the full report, CSAO has a unique set of crypto markets with high levels of activity on local crypto exchanges, with merchant services, and in DeFi.
| Country | Region | Overall Index Ranking | Centralized ranking of the value of the service received | Ranking the value of centralized retail service received | DeFi stock received ranking | Retail DeFi Value Ranked |
| India | CSAO | 1 | 1 | 1 | 3 | 2 |
| Nigeria | Sub-Saharan Africa | 2 | 5 | 2 | 2 | 3 |
| Indonesia | CSAO | 3 | 6 | 6 | 1 | 1 |
| UNITED STATES | North America | 4 | 2 | 12 | 4 | 4 |
| Vietnam | CSAO | 5 | 3 | 3 | 6 | 5 |
| Ukraine | Eastern Europe | 6 | 7 | 5 | 5 | 6 |
| Russia | Eastern Europe | 7 | 11 | 7 | 7 | 7 |
| Philippines | CSAO | 8 | 9 | 8 | 14 | 9 |
| Pakistan | CSAO | 9 | 4 | 4 | 18 | 13 |
| Brazil | LATAM | 10 | 8 | 10 | 10 | 14 |
| Türkiye | Middle East and North Africa | 11 | 14 | 11 | 15 | 11 |
| United Kingdom | Central, Northern and Western Europe | 12 | 12 | 21 | 9 | 8 |
| Venezuela | LATAM | 13 | 17 | 16 | 11 | 12 |
| Mexico | LATAM | 14 | 18 | 17 | 13 | 10 |
| Argentina | LATAM | 15 | 13 | 13 | 17 | 20 |
| Thailand | CSAO | 16 | 16 | 15 | 19 | 16 |
| Cambodia | CSAO | 17 | 10 | 9 | 35 | 23 |
| Canada | North America | 18 | 22 | 26 | 16 | 15 |
| South Korea | East Asia | 19 | 15 | 14 | 33 | 33 |
| China | East Asia | 20 | 20 | 18 | 24 | 22 |
Global crypto activity increases
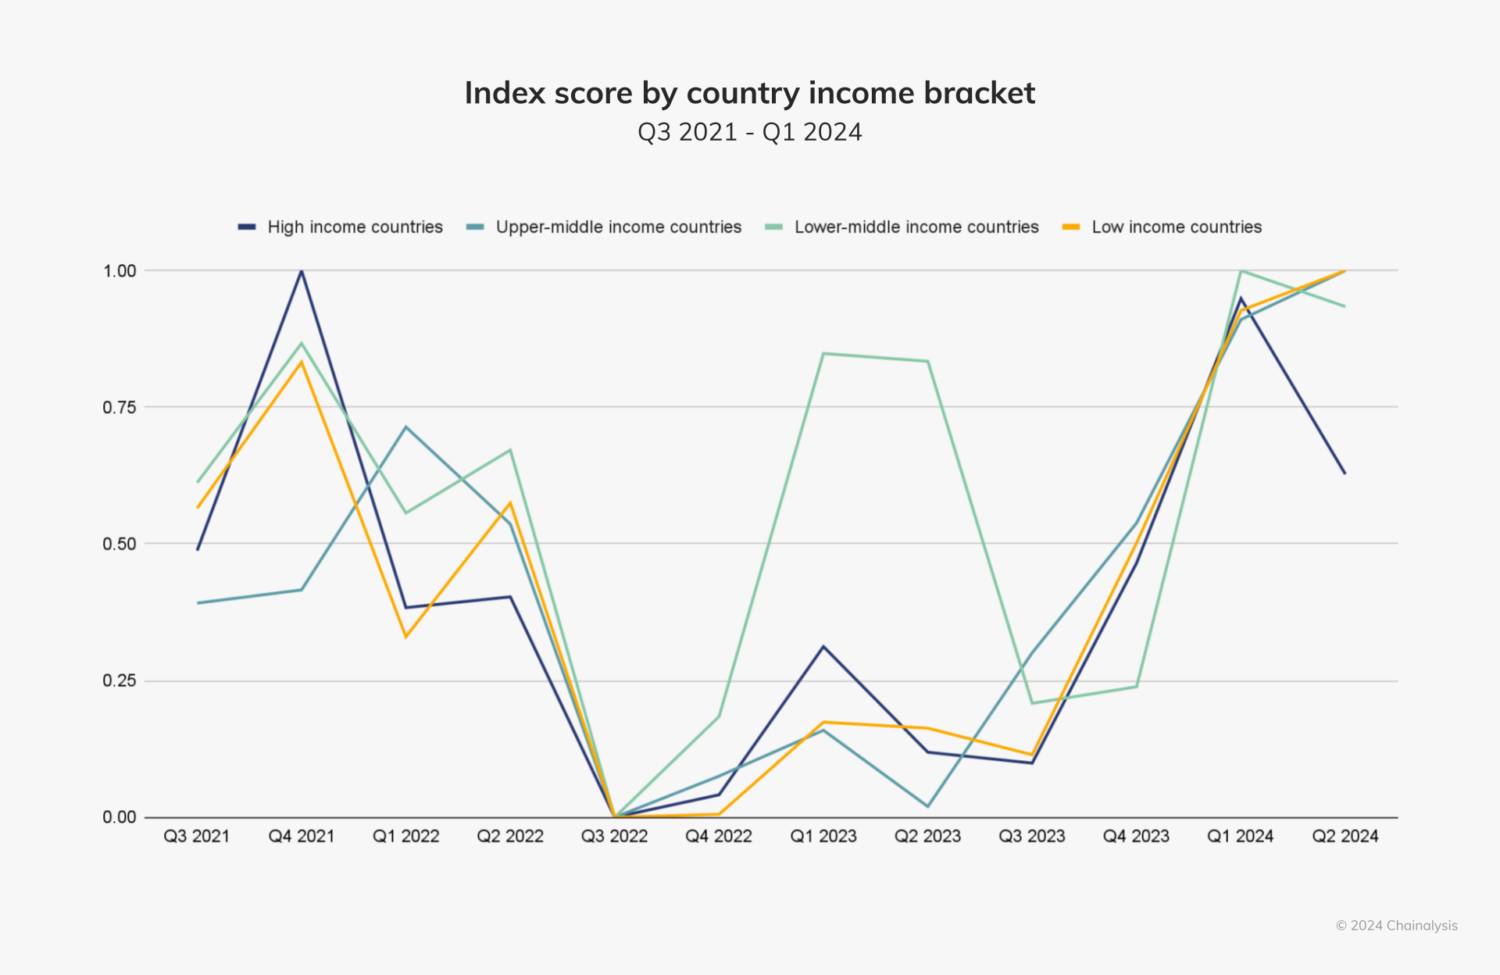
Between Q4 2023 and Q1 2024, the total value of global crypto activity increased significantly, reaching higher levels than 2021 during the crypto bull market. We can see this trend in the chart below, where we apply our adoption index methodology globally by summing the index scores of all 151 countries for each quarter from Q3 2021 to Q2 2024, and re-indexing them again to show growth in global adoption over time.

Last year, growth in crypto adoption was primarily driven by lower-middle-income countries. This year, however, crypto activity has increased in countries across all income brackets, with a decline in high-income countries since the start of 2024.
The launch of the Bitcoin ETF in the United States triggered an increase in the total value of Bitcoin activity across all regions, with particularly strong year-over-year growth in institutional-sized transfers and in regions with higher income countries, such as North America and Western Europe. On the contrary, the year-over-year growth of stablecoins was higher among retail and professional transfers, and supports real-world use cases in low-income and lower-middle-income countries in regions such as sub-Saharan Africa and Latin America. , especially.
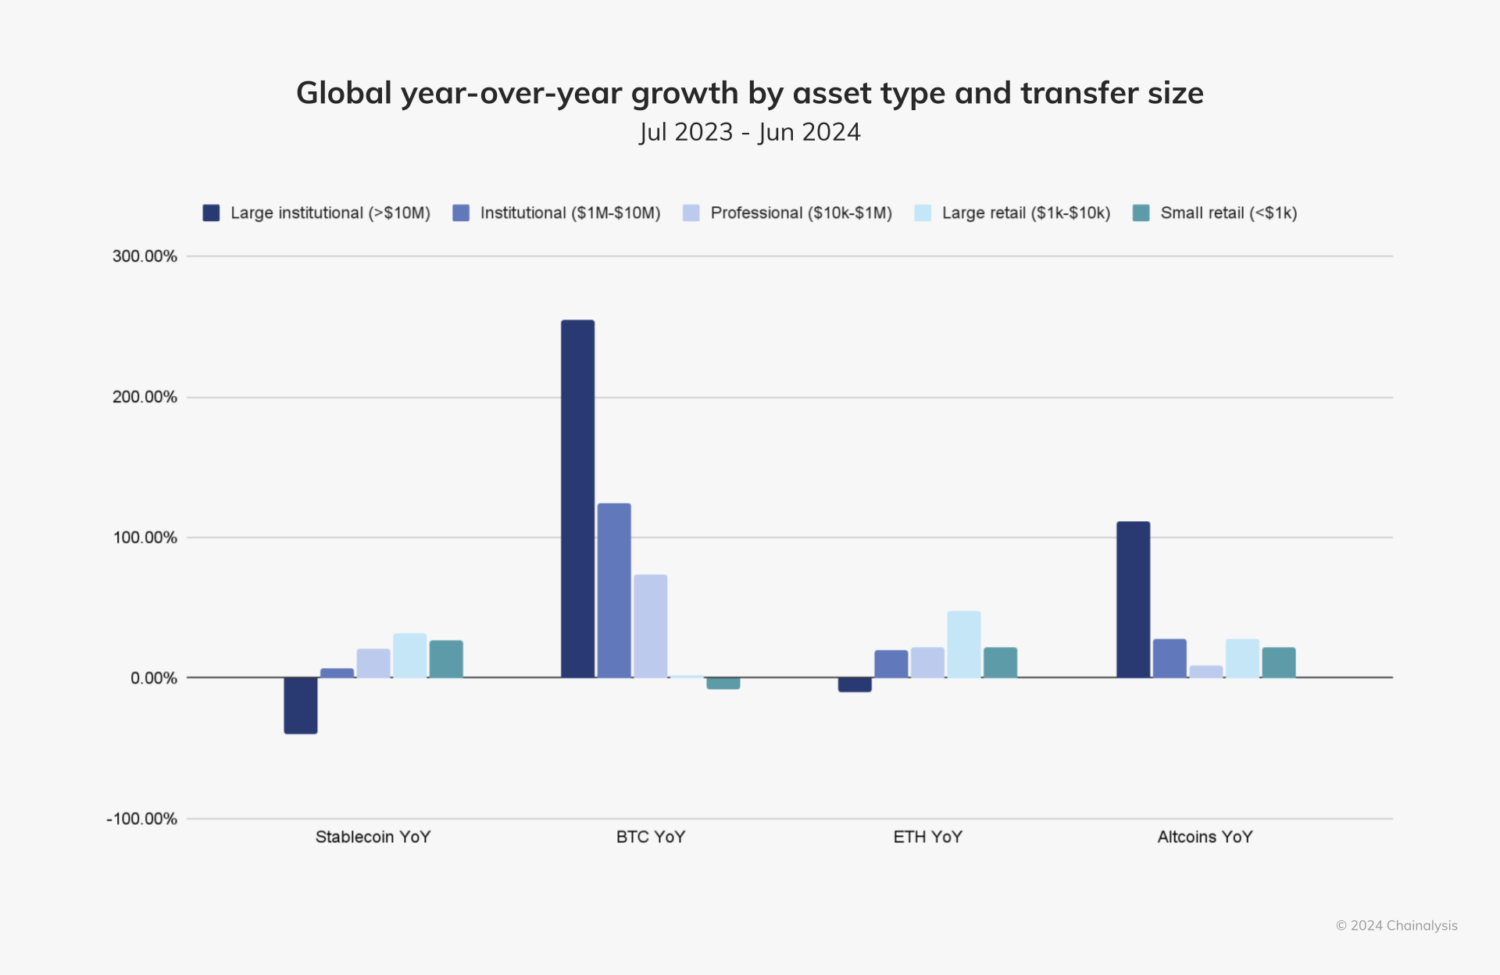
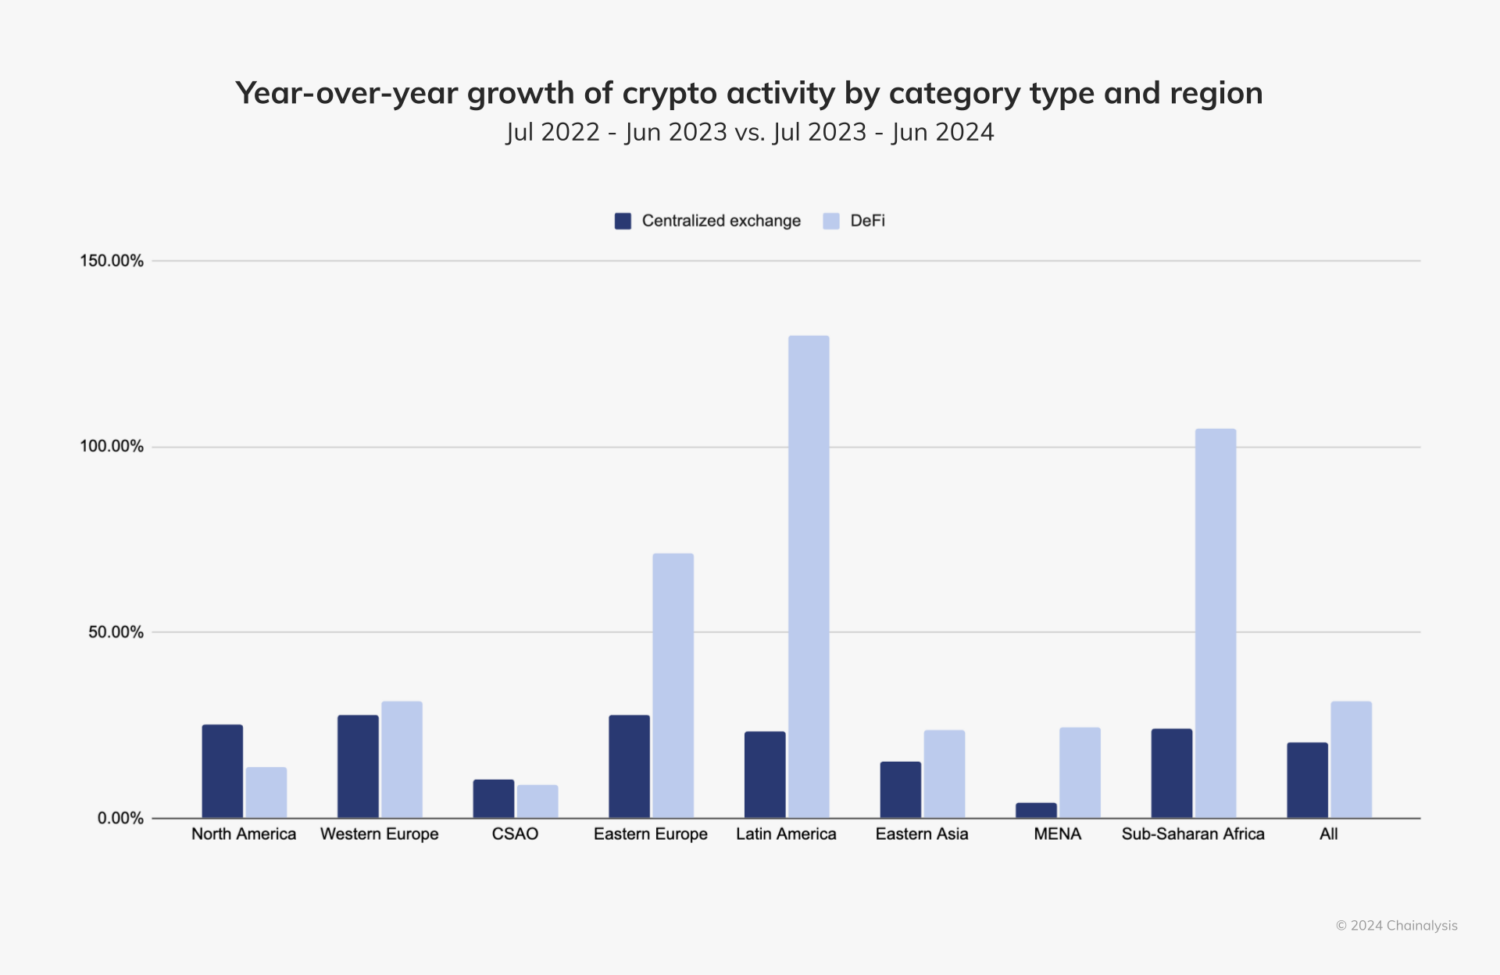
When we look at year-over-year growth in terms of service types, we see that DeFi activity has grown significantly in Sub-Saharan Africa, Latin America, and Eastern Europe. This growth has likely led to an increase in altcoin activity in these regions, as shown in the chart above.
Read our full Cryptocurrency Geography 2024 report for more information on these trends, recent regulatory developments, and how countries around the world are using crypto.
This website contains links to third party sites that are not under the control of Chainalysis, Inc. or its affiliates (collectively “Chainalysis”). Access to this information does not imply association, endorsement, approval or recommendation by Chainalysis of the site or its operators, and Chainalysis is not responsible for the products, services or other content contained therein. hosted.
This material is provided for informational purposes only and is not intended to provide legal, tax, financial, or investment advice. Recipients should consult their own advisors before making these types of decisions. Chainalysis assumes no responsibility for any decision made or any other act or omission in connection with the recipient’s use of this material.
Chainalysis does not guarantee the accuracy, completeness, timeliness, suitability or validity of the information contained in this report and will not be liable for any claims attributable to errors, omissions or other inaccuracies in any part of this report. material.